
Pages
Last updated August 27, 2026
Overview: The Pages dashboard (Dash Pages) tracks the custom landing pages generated for each location — total page count and type mix (Primary, Upsell, Demo), page-level view rankings, total views over time, button click activity, and time-of-day/day-of-week view patterns. Data can be scoped by client, city, location, and individual page.
Screenshot 1 — Total Pages, Page Types, Top page views, Total Page Views, Button Clicks, Heatmap, and Views by day of week
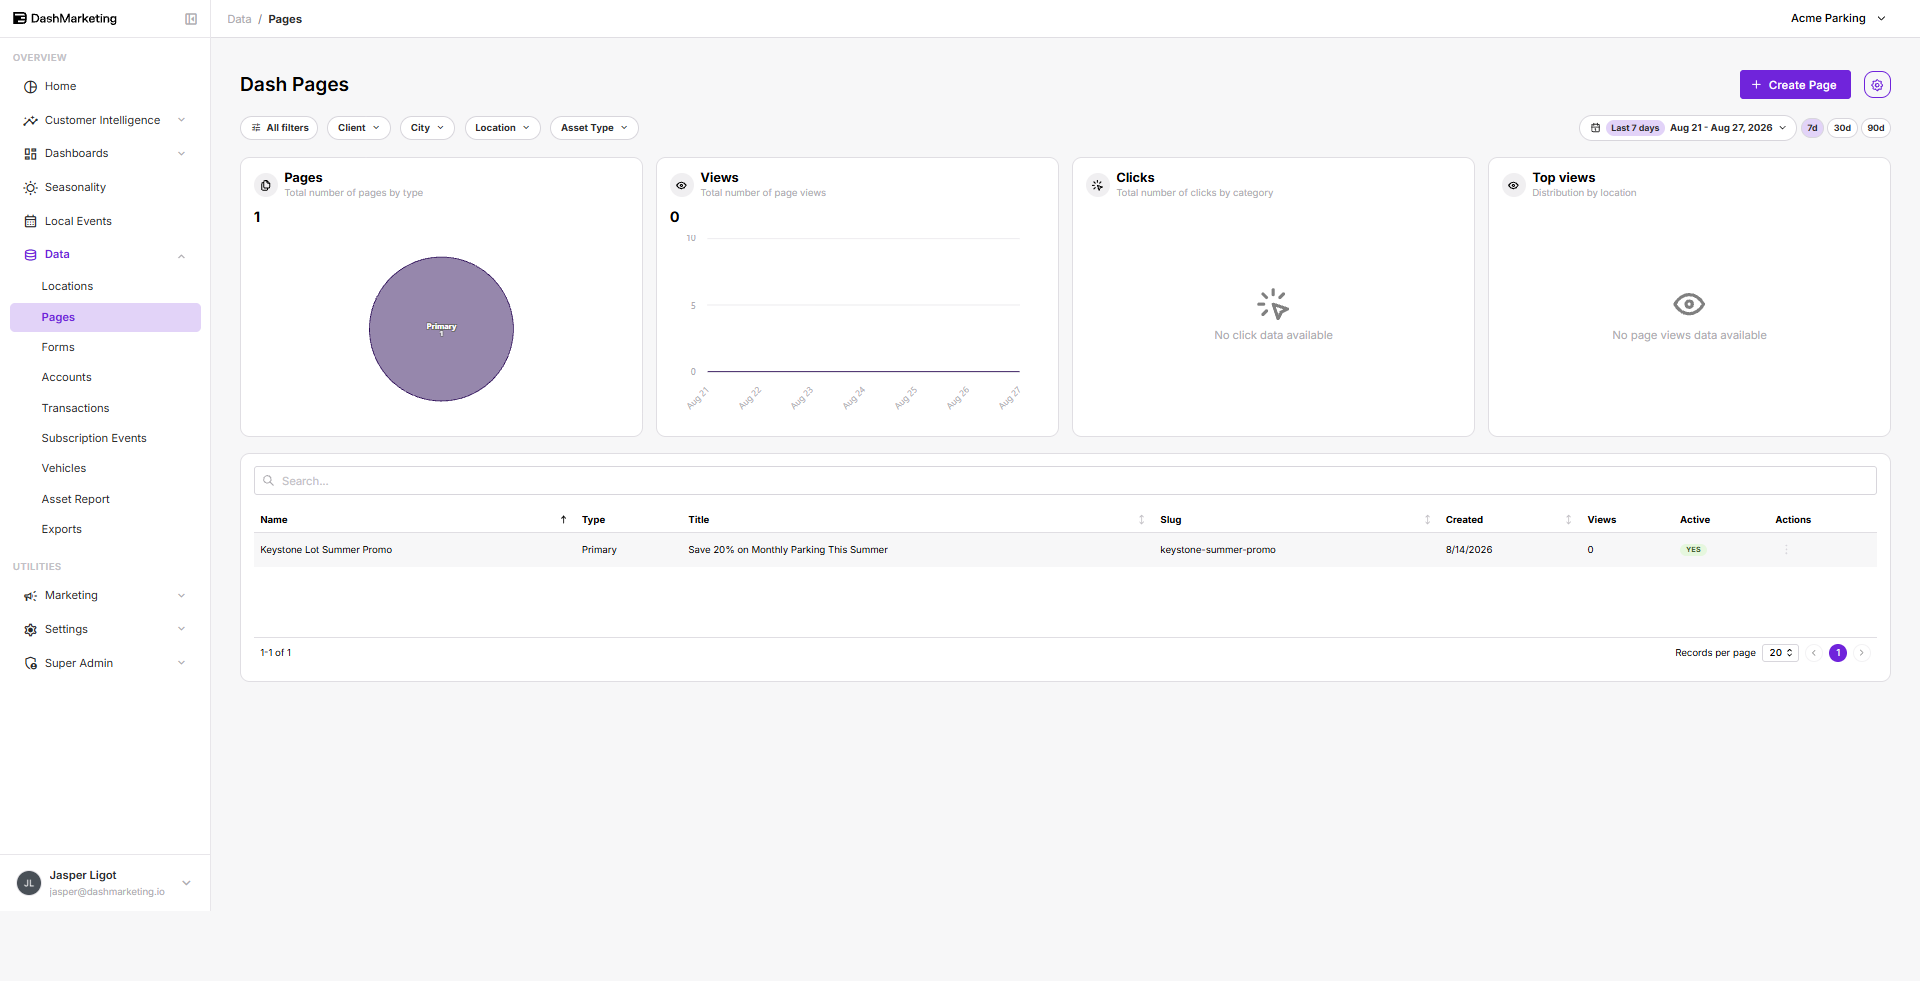 <table style="min-width: 75px;"> <colgroup><col style="min-width: 25px;"><col style="min-width: 25px;"><col style="min-width: 25px;"></colgroup><tbody><tr><td colspan="1" rowspan="1"><p><strong>#</strong></p></td><td colspan="1" rowspan="1"><p><strong>Element</strong></p></td><td colspan="1" rowspan="1"><p><strong>What it does</strong></p></td></tr><tr><td colspan="1" rowspan="1"><p>1</p></td><td colspan="1" rowspan="1"><p>All filters + Client / City / Location / Page pills</p></td><td colspan="1" rowspan="1"><p>Opens a filter drawer plus quick dropdown pills to scope every card by client, city, location, or an individual page</p></td></tr><tr><td colspan="1" rowspan="1"><p>2</p></td><td colspan="1" rowspan="1"><p>Date range + 7d/30d/90d toggle</p></td><td colspan="1" rowspan="1"><p>Sets the reporting window; quick-select buttons instantly change the date range and refresh every card</p></td></tr><tr><td colspan="1" rowspan="1"><p>3</p></td><td colspan="1" rowspan="1"><p>Actions button (View Page Data)</p></td><td colspan="1" rowspan="1"><p>Opens a menu with a View Page Data option for inspecting the underlying page-level dataset</p></td></tr><tr><td colspan="1" rowspan="1"><p>4</p></td><td colspan="1" rowspan="1"><p>Total Pages card</p></td><td colspan="1" rowspan="1"><p>Total number of Dash Pages, plus Avg. pages per location, Active, and Inactive counts</p></td></tr><tr><td colspan="1" rowspan="1"><p>5</p></td><td colspan="1" rowspan="1"><p>Page Types bubble chart</p></td><td colspan="1" rowspan="1"><p>Visualizes the mix of page types (Primary, Upsell, Demo) as proportionally sized bubbles with page counts</p></td></tr><tr><td colspan="1" rowspan="1"><p>6</p></td><td colspan="1" rowspan="1"><p>Top page views table</p></td><td colspan="1" rowspan="1"><p>Ranks individual pages by view count, showing page name, page type, and location, with a hide/eye icon per row</p></td></tr><tr><td colspan="1" rowspan="1"><p>7</p></td><td colspan="1" rowspan="1"><p>Total Page Views chart</p></td><td colspan="1" rowspan="1"><p>Area chart of daily page views over the selected period, with a percent change indicator vs the prior period</p></td></tr><tr><td colspan="1" rowspan="1"><p>8</p></td><td colspan="1" rowspan="1"><p>Button Clicks donut, Page View Heatmap, Views by day of week</p></td><td colspan="1" rowspan="1"><p>Button Clicks shows click volume by category/subcategory (e.g. Payment, Transient); Page View Heatmap shows views by day and hour; Views by day of week ranks total views per weekday</p></td></tr></tbody> </table>
Was this page helpful?