
Seasonality
Last updated August 27, 2026
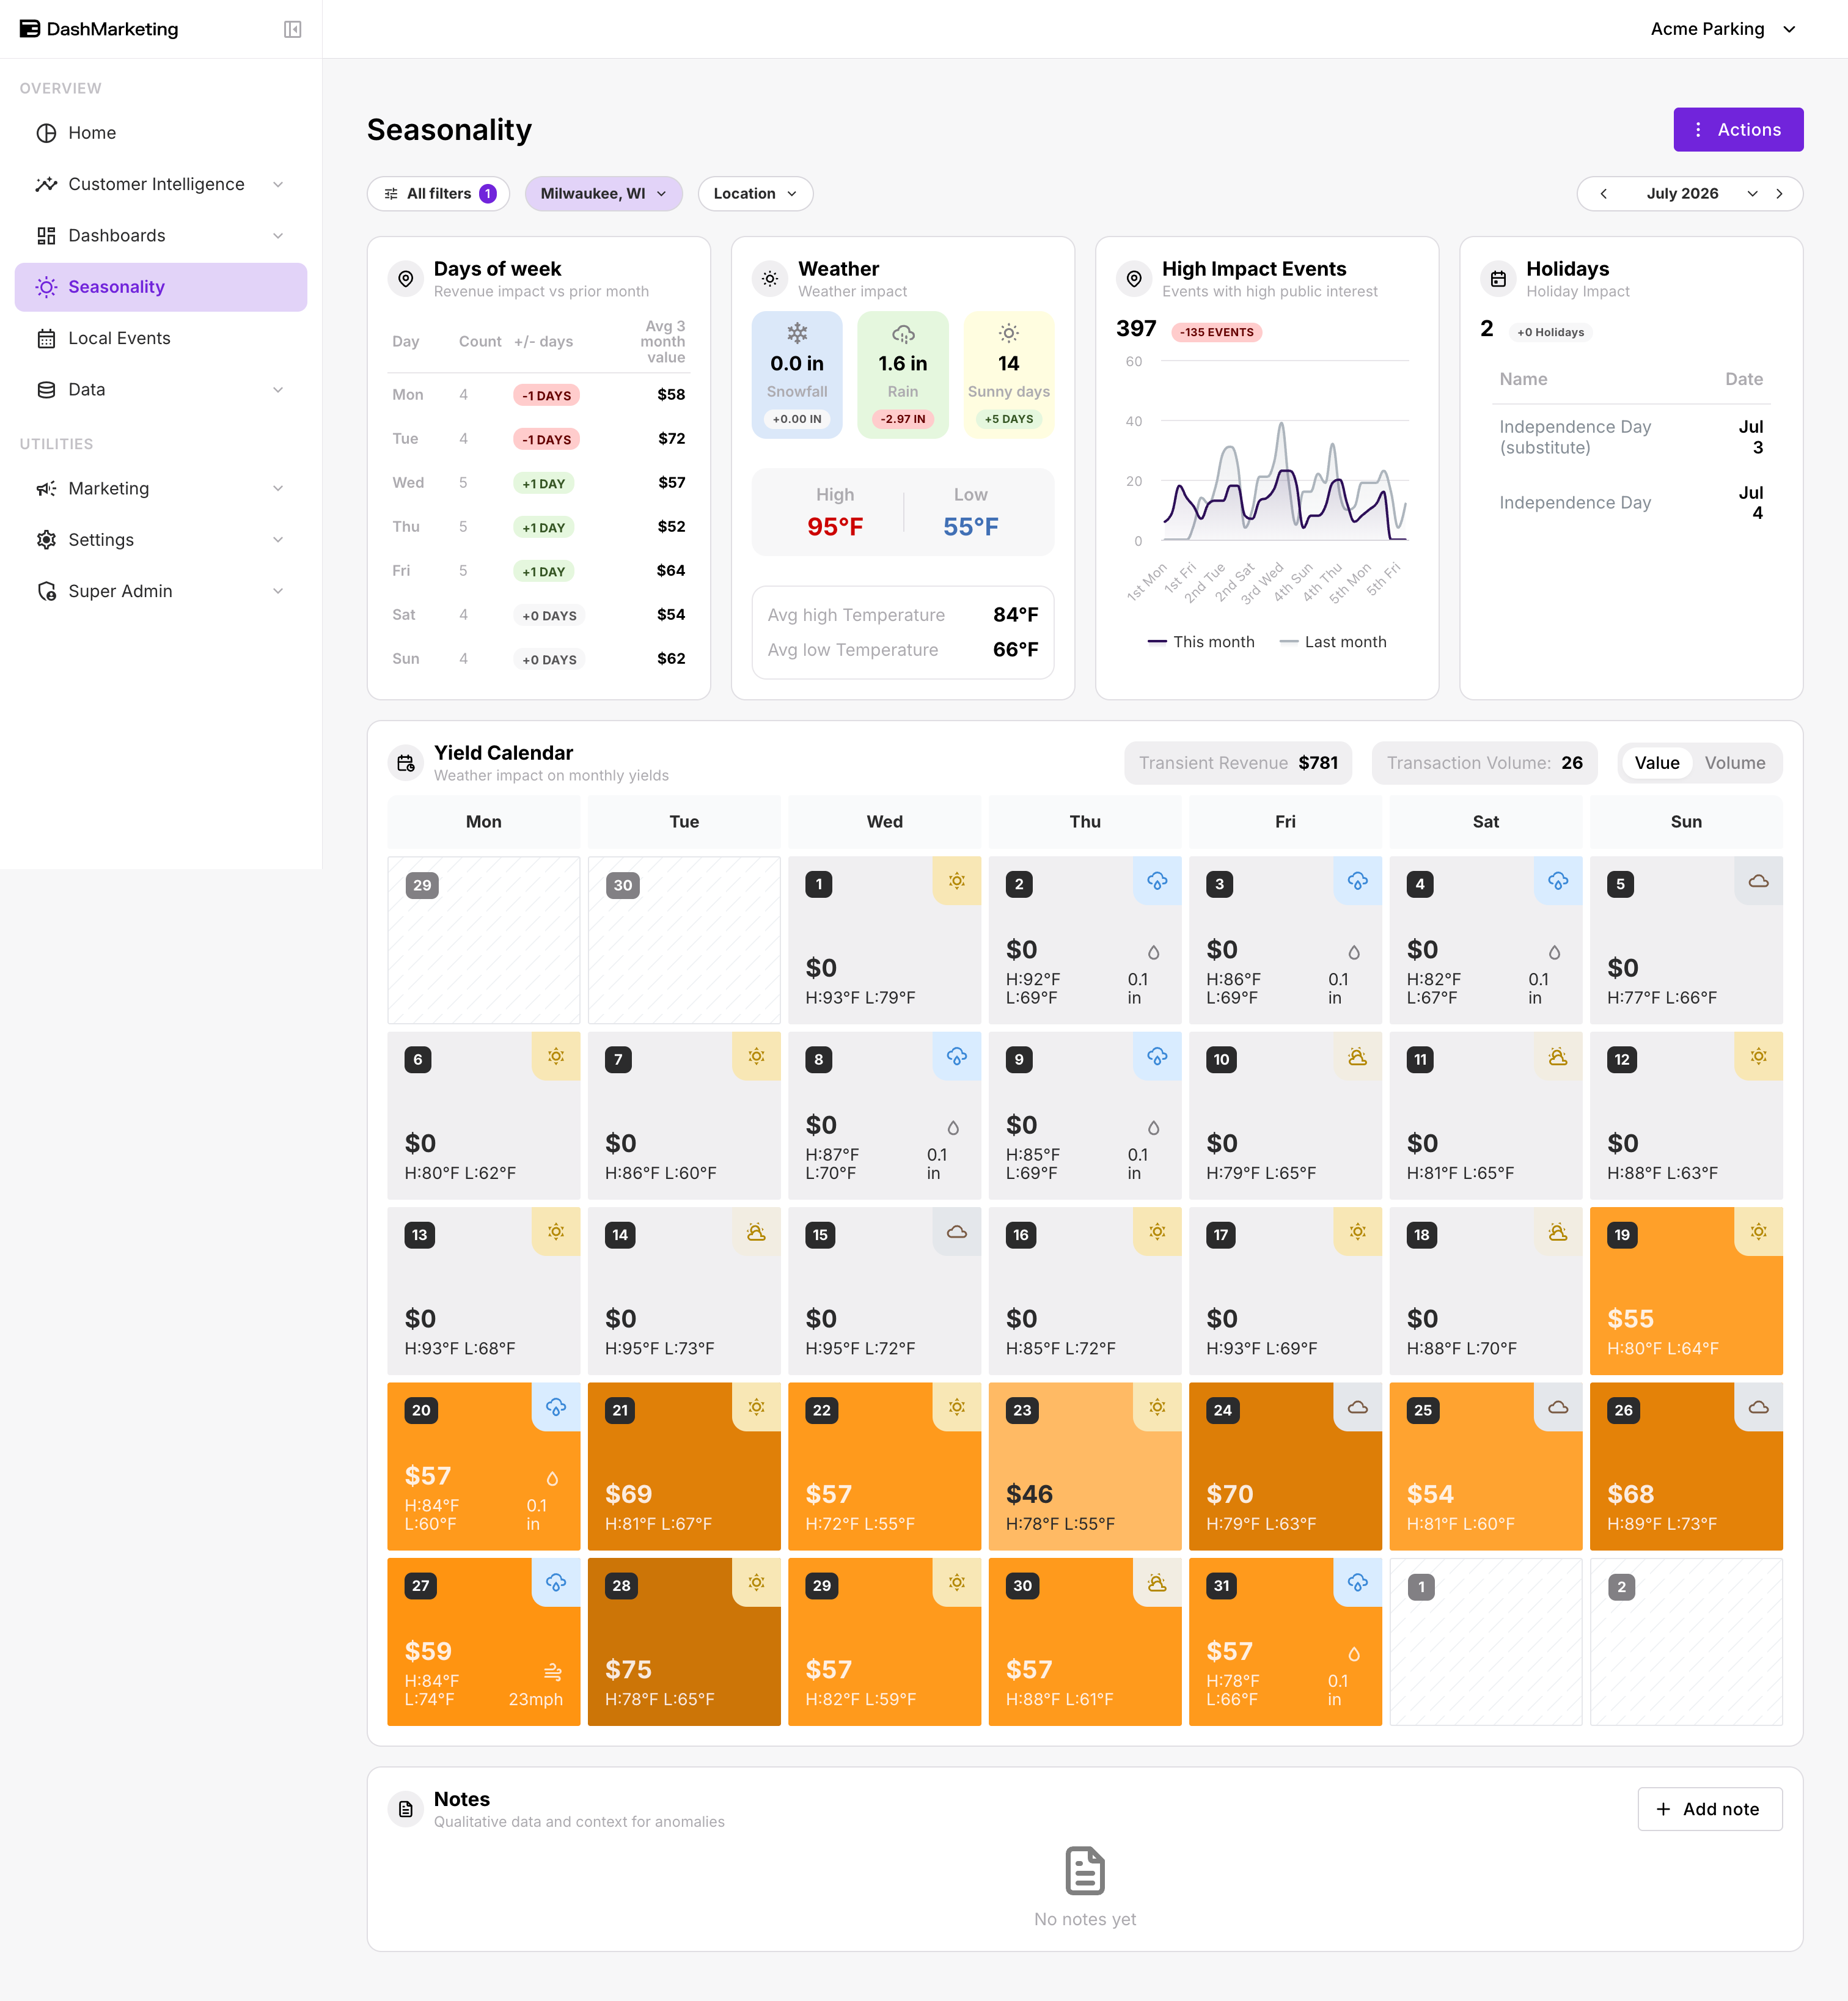
Overview: The Seasonality page analyzes how weather, day-of-week patterns, local events, and holidays influence parking revenue and transaction volume for a selected city or location. Its centerpiece is a Yield Calendar heat map that projects daily transient revenue based on historical seasonal patterns.
| # | Element | What it does |
|---|---|---|
| 1 | All filters | Opens a comprehensive filter drawer for refining the page by city, location, vendor, and other operational dimensions. |
| 2 | City / Location pills | Quick dropdowns to scope every card and the Yield Calendar to a specific city (e.g. Washington, DC) or an individual parking location. |
| 3 | Month navigator | Left/right arrows step through months (e.g. August 2026); drives every card and the Yield Calendar grid below. |
| 4 | Days of week table | Shows revenue impact by weekday: Count (occurrences this month), +/- days versus prior month, and Avg 3 month value per weekday. |
| 5 | Weather panel | Shows Snowfall, Rain, and Sunny days totals with month-over-month deltas, plus High/Low temps and average high/low for the period. |
| 6 | High Impact Events chart | Line chart comparing this month vs last month’s high-interest event counts by week; total events and change vs prior period shown above the chart. |
| 7 | Holidays panel | Lists holidays falling within the selected month and their impact on parking demand. Showed No data for this period during the walkthrough. |
| 8 | Yield Calendar header | Shows Transient Revenue and Transaction Volume totals for the month, plus a Value / Volume toggle that switches every day cell between dollar amounts and transaction counts. |
| 9 | Day cells | Each cell shows the date, daily transient revenue (or transaction volume in Volume mode), a weather icon, and high/low temperature. Days beyond the forecast horizon show $— placeholders. |
| 10 | Precipitation indicator | A small droplet icon with expected inches of rain/snow appears on days with forecast precipitation. |
| 11 | Notes section | Add note button for logging qualitative context on demand anomalies. Showed No notes yet during the walkthrough. |
Was this page helpful?