
Transients
Last updated August 27, 2026
Overview: The Transients dashboard analyzes single-visit (transient) parking activity across locations — revenue, average transaction value, frequency by customer type, top-performing locations, revenue by payment platform, time-of-day patterns, and audience segmentation. Data can be scoped by city, location, vendor, client, and product, over 7/30/90-day windows.
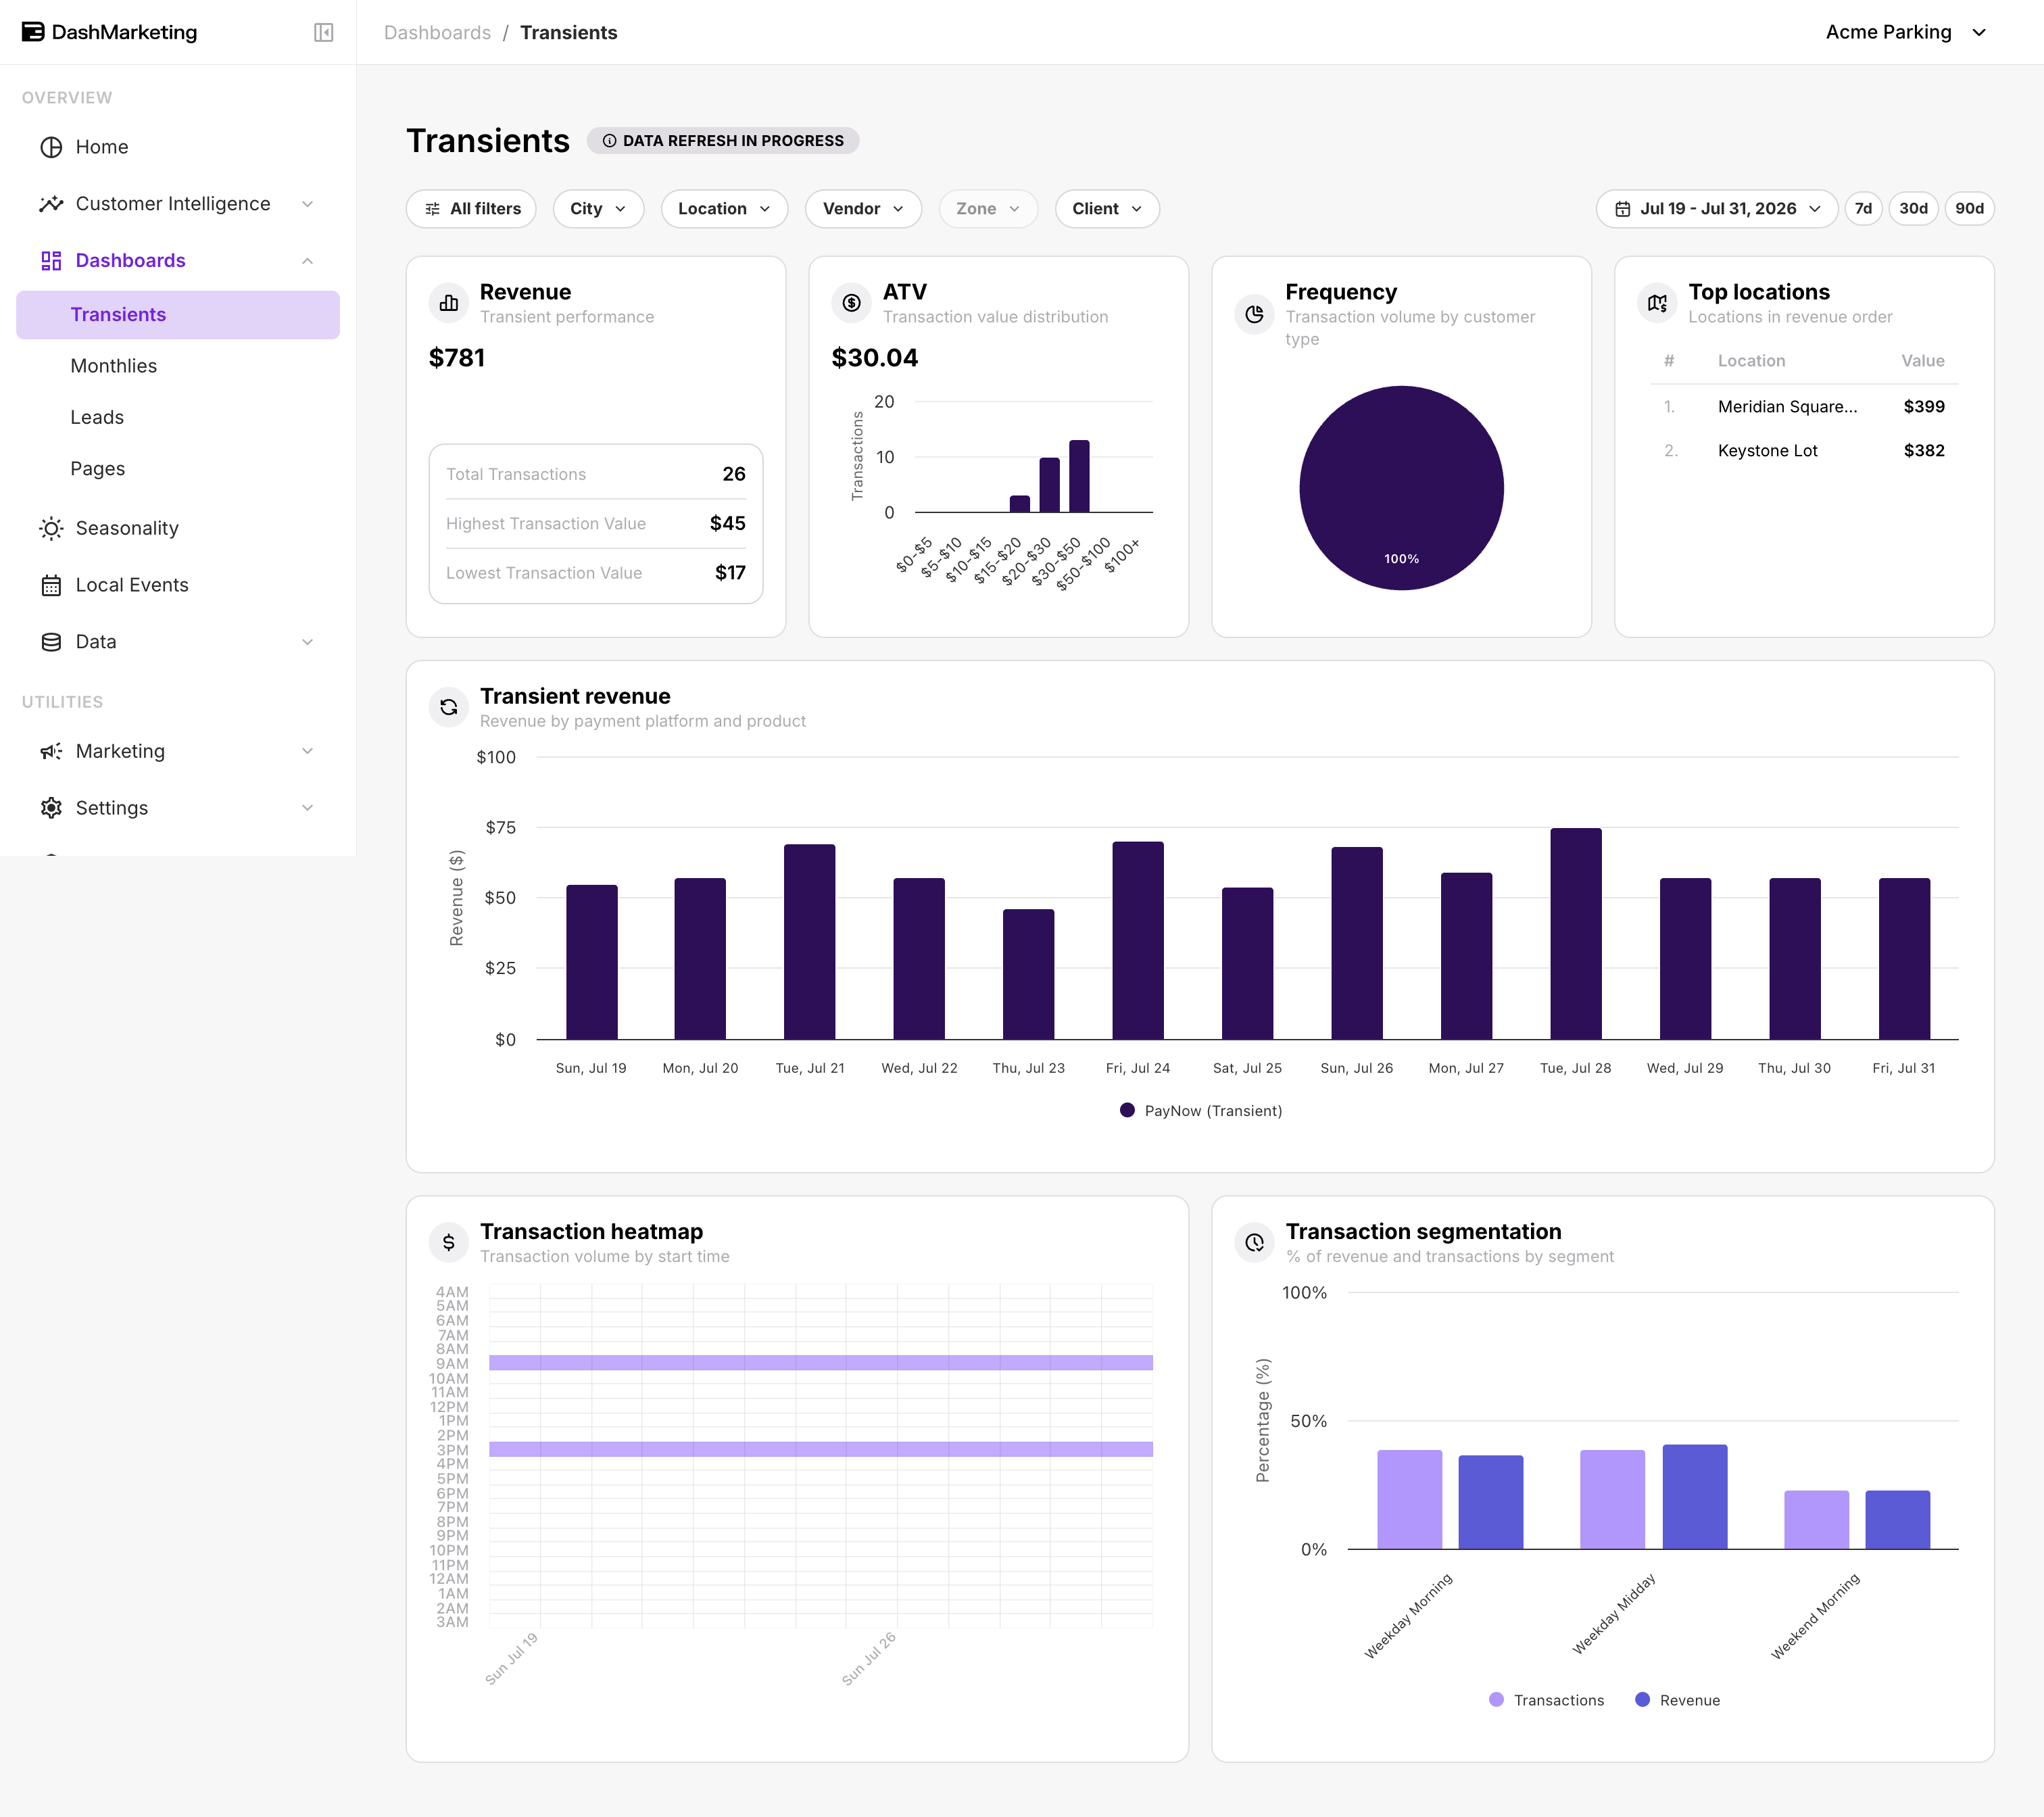
| # | Element | What it does |
|---|---|---|
| 1 | All filters | Opens a filter drawer for refining the dashboard by additional operational dimensions beyond the toolbar pills. |
| 2 | City / Location / Vendor / Client / Product pills | Quick dropdown filters that scope every card and chart to a specific city, location, vendor (payment platform), client, or product type. |
| 3 | Date range + 7d / 30d / 90d toggle | Sets the reporting window; the 7d / 30d / 90d quick-select buttons instantly change the date range and refresh every card and chart. |
| 4 | Revenue card | Shows total transient revenue for the period, plus Total Transactions, Highest Transaction Value, and Lowest Transaction Value. |
| 5 | ATV card | Shows Average Transaction Value (ATV) with a histogram displaying transaction-count distribution across price buckets ($0–$5 through $100+). |
| 6 | Frequency donut | Breaks down transaction volume by customer type, with each segment shown as a percentage. |
| 7 | Top locations list | Ranks locations by transient revenue for the selected period, with dollar values per location. |
| 8 | Transient revenue chart | Stacked bar chart of daily revenue broken down by payment platform and product (Designa, Flash PARCS, Flix, Honk, JustPark, ParkMobile, ParkWhiz, SpotHero, Vanguard, ZipBy, etc.). |
| 9 | Transaction heatmap | Grid of transaction volume by day and start-time hour (4 AM–3 AM); darker purple cells indicate higher transaction volume at that hour/day. |
| 10 | Transaction segmentation chart | Bar chart comparing % of Transactions vs. % of Revenue across audience segments (Commuter, Weekday Morning, Weekday Midday, Weekday Evening, Weekend Morning, Weekend Evening). |
Was this page helpful?