
Leads
Last updated August 27, 2026
Overview: The Leads dashboard tracks inbound leads generated through Dash-hosted pages and forms — volume over time, conversion rate, top lead-generating locations, top email domains, and a searchable log of individual lead submissions. Data can be scoped by client, city, location, and page, and filtered to show only converted leads.
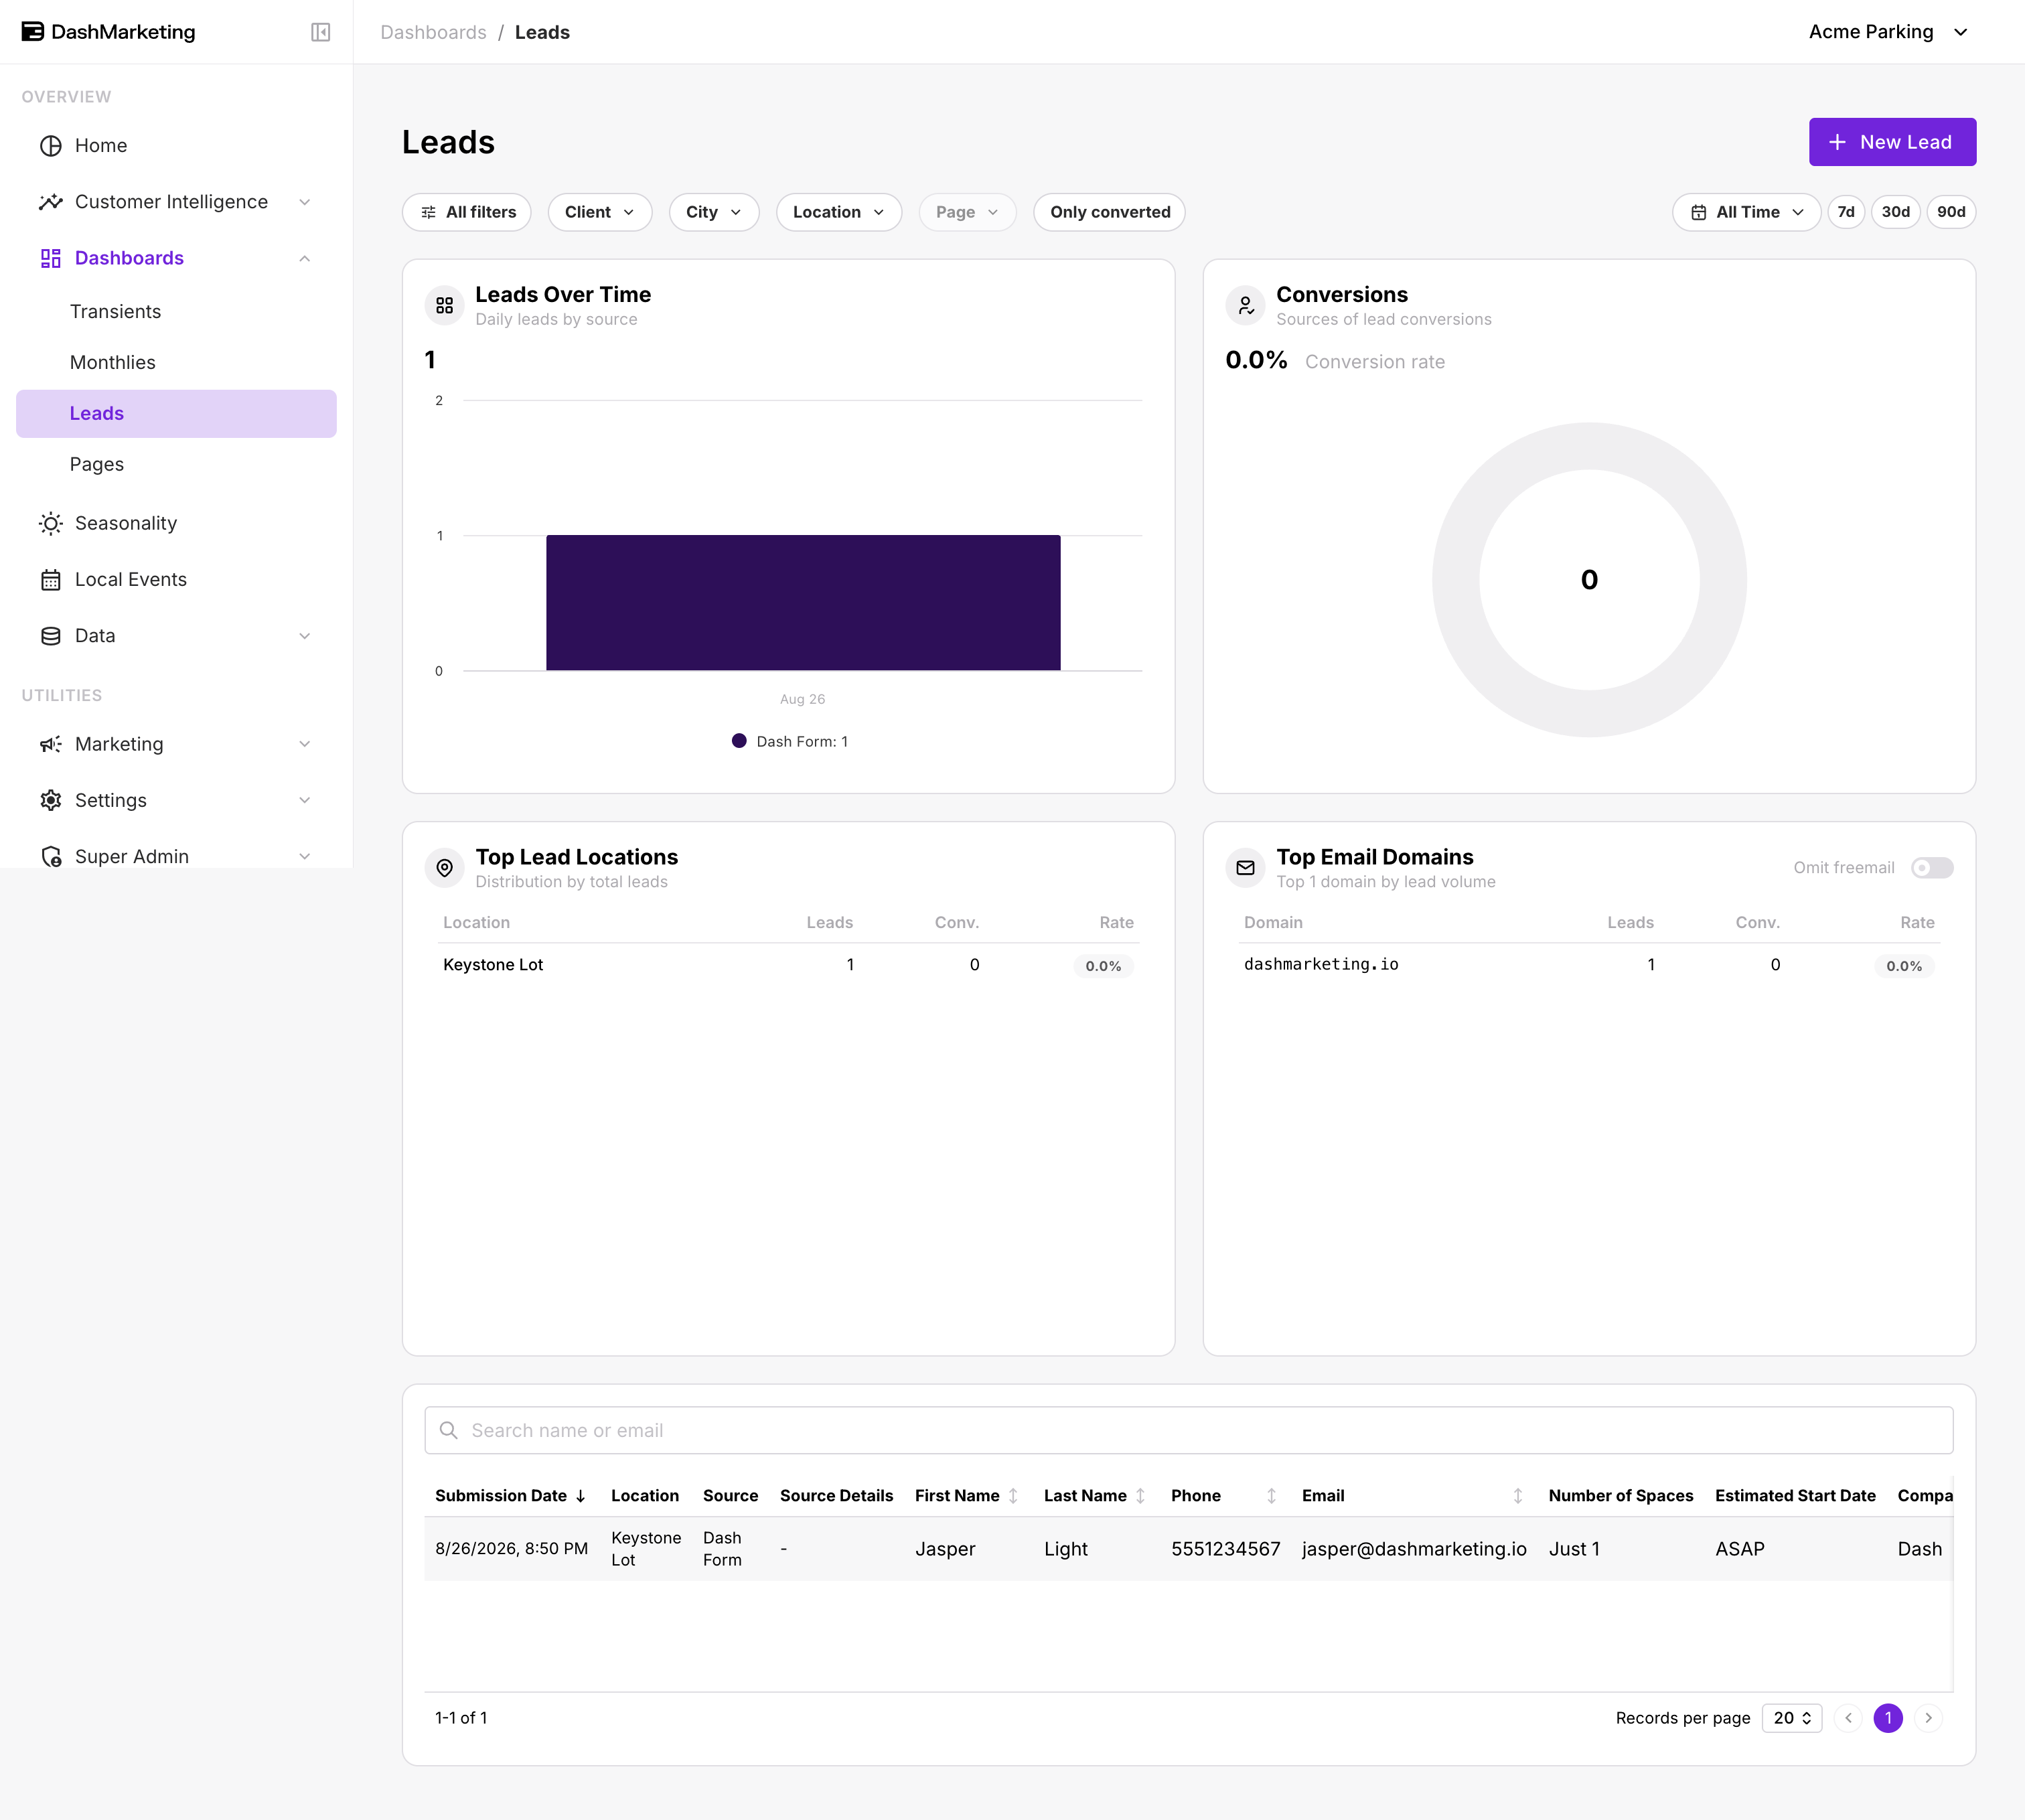
| # | Element | What it does |
|---|---|---|
| 1 | New Lead button | Opens a form to manually add a new lead record to the log. |
| 2 | All filters + Client / City / Location / Page pills | Opens a filter drawer plus quick dropdown pills to scope leads by client, city, location, or the specific landing page they came from. |
| 3 | Only converted toggle | Restricts every card and the log below to leads that have been marked as converted. |
| 4 | Date range + 7d / 30d / 90d toggle | Sets the reporting window; quick-select buttons instantly change the date range and refresh every card and the log. |
| 5 | Leads Over Time chart | Daily lead-volume bar chart broken down by source (e.g. Dash Form), with total leads for the period shown above. |
| 6 | Conversions donut | Shows overall conversion rate and a breakdown of conversions by lead source. |
| 7 | Top Lead Locations & Top Email Domains | Top Lead Locations ranks locations by lead volume, conversions, and conversion rate. Top Email Domains ranks the top 28 email domains by lead volume, with an Omit freemail toggle to exclude consumer email providers such as Gmail. |
| 8 | Search bar | Filters the lead submissions table by name or email. |
| 9 | Lead submission rows | Each row shows Submission Date, Location, Source, Source Details, First/Last Name, Phone, Email, Number of Spaces, Estimated Start Date, Company, Contacted status, Converted status, and an Action menu. |
| 10 | Pagination controls | Provides a records-per-page selector and page navigator (e.g. 197 total leads across 10 pages). |
Was this page helpful?