
Client view references
Last updated September 8, 2026
Every screen a client user can reach, what's on it, and what it's good for. Use this when a client asks "what am I looking at?" — the short descriptions here are written to be lifted straight into an email or a walkthrough call.
All figures on every screen are scoped to the locations attached to that client.
Home
The landing screen. A one-glance summary of the month.
Revenue Overview — total revenue for the month and growth against last month
Customer Overview — total customers
Revenue Performance — transient vs monthly revenue, with a six-month stacked trend
Customer Behavior — the average customer profile, broken into visit-window types (weekday evening, weekend morning, and so on)
Seasonality and Events — shortcuts into weather impact and upcoming events
Landing Pages — DashPages views, clicks, and view-to-click rate
Customer Acquisition — forms submitted, leads, conversions, and conversion rate
Filters: City, Location. Period: month picker.
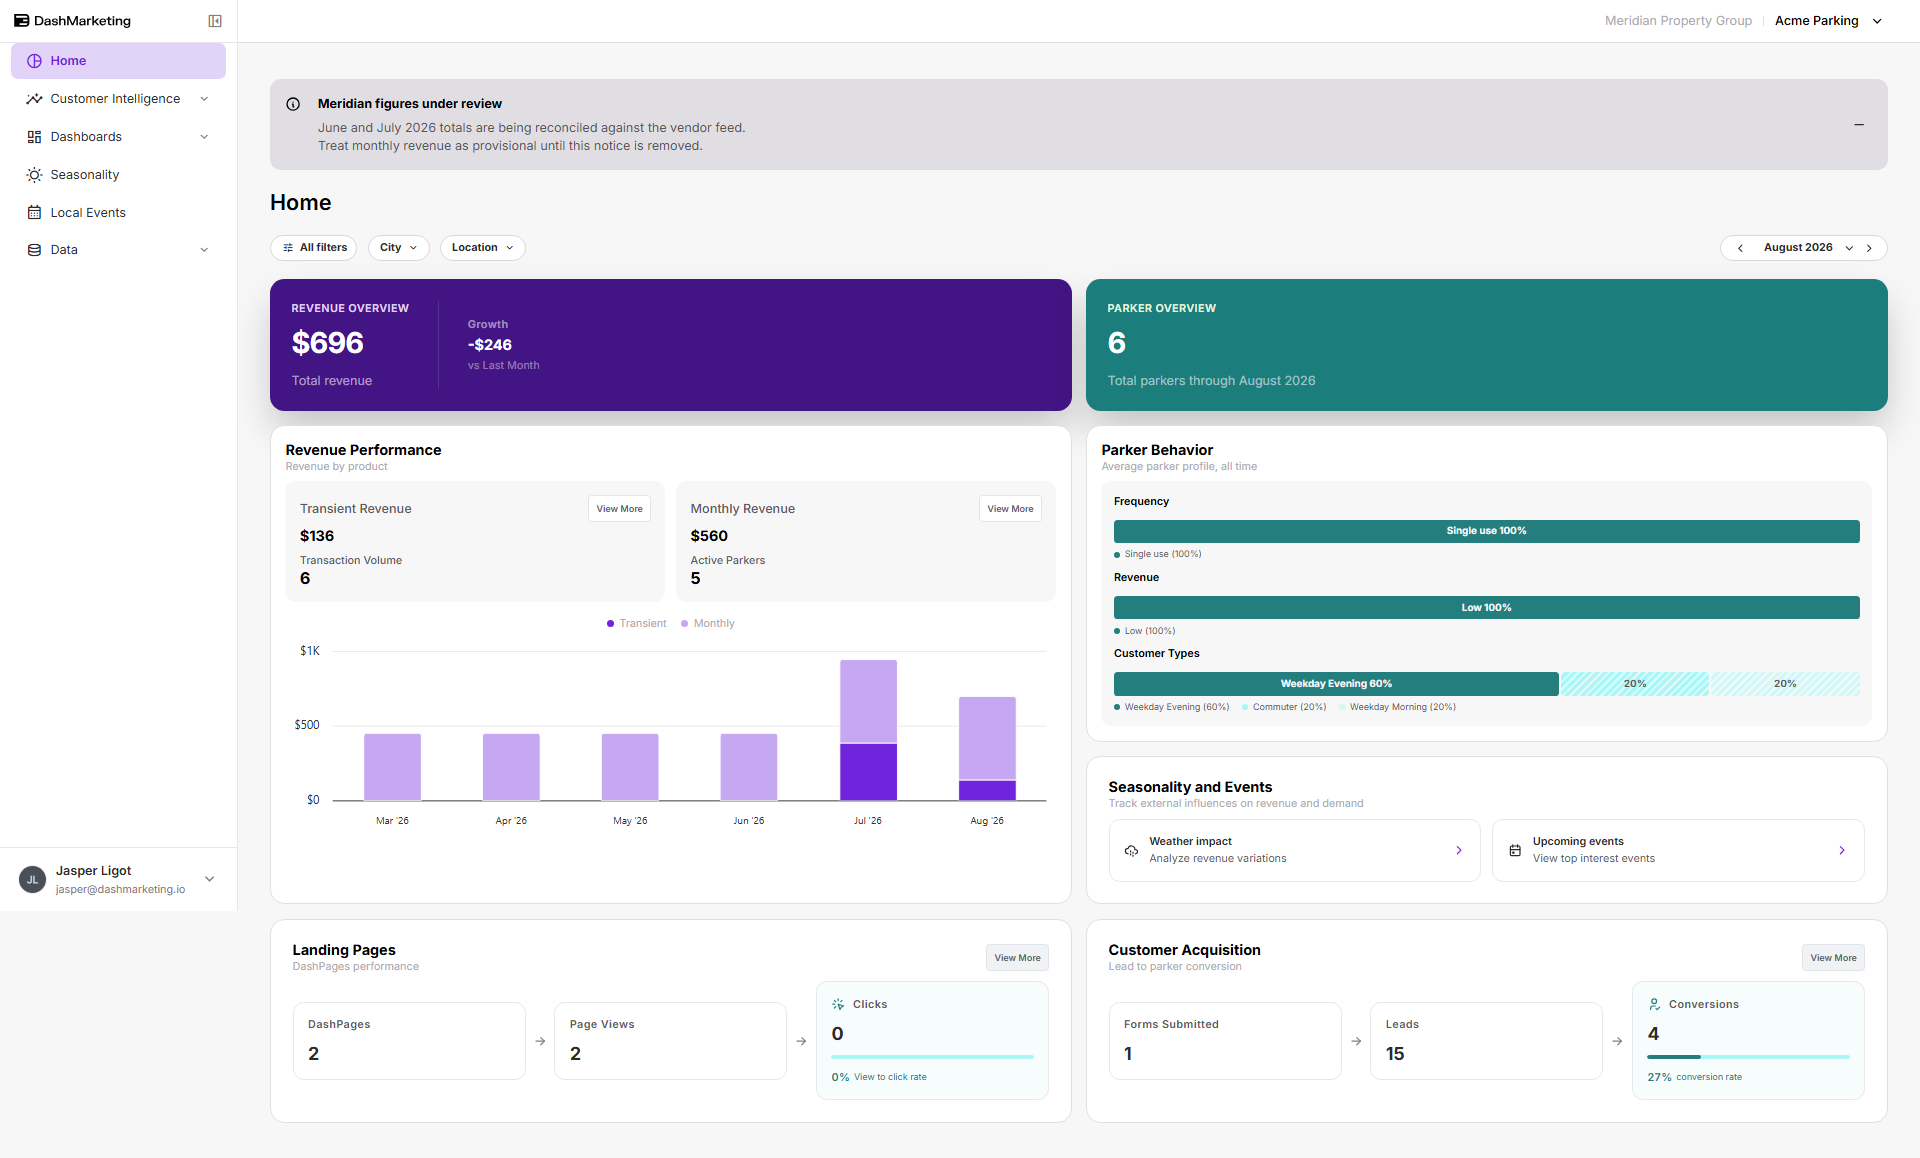 📸 Screenshot needed — client-home-full.png Client view Home, scrolled to show the full page in one capture if possible, or two stacked captures. Use a client with populated data — an empty Customer Behavior card makes a poor first impression in documentation.
Customer Intelligence
Parkers
The client's known parker base and how it behaves.
Parker Overview — known parkers, unknown parkers as a share of the base, growth this month, average value per parker
Monthly Growth sparkline
Transactions, Revenue, Persona, and Product Mix summary cards
Transactions vs Persona Matrix
Filters: City, Location, Vendor, Persona.
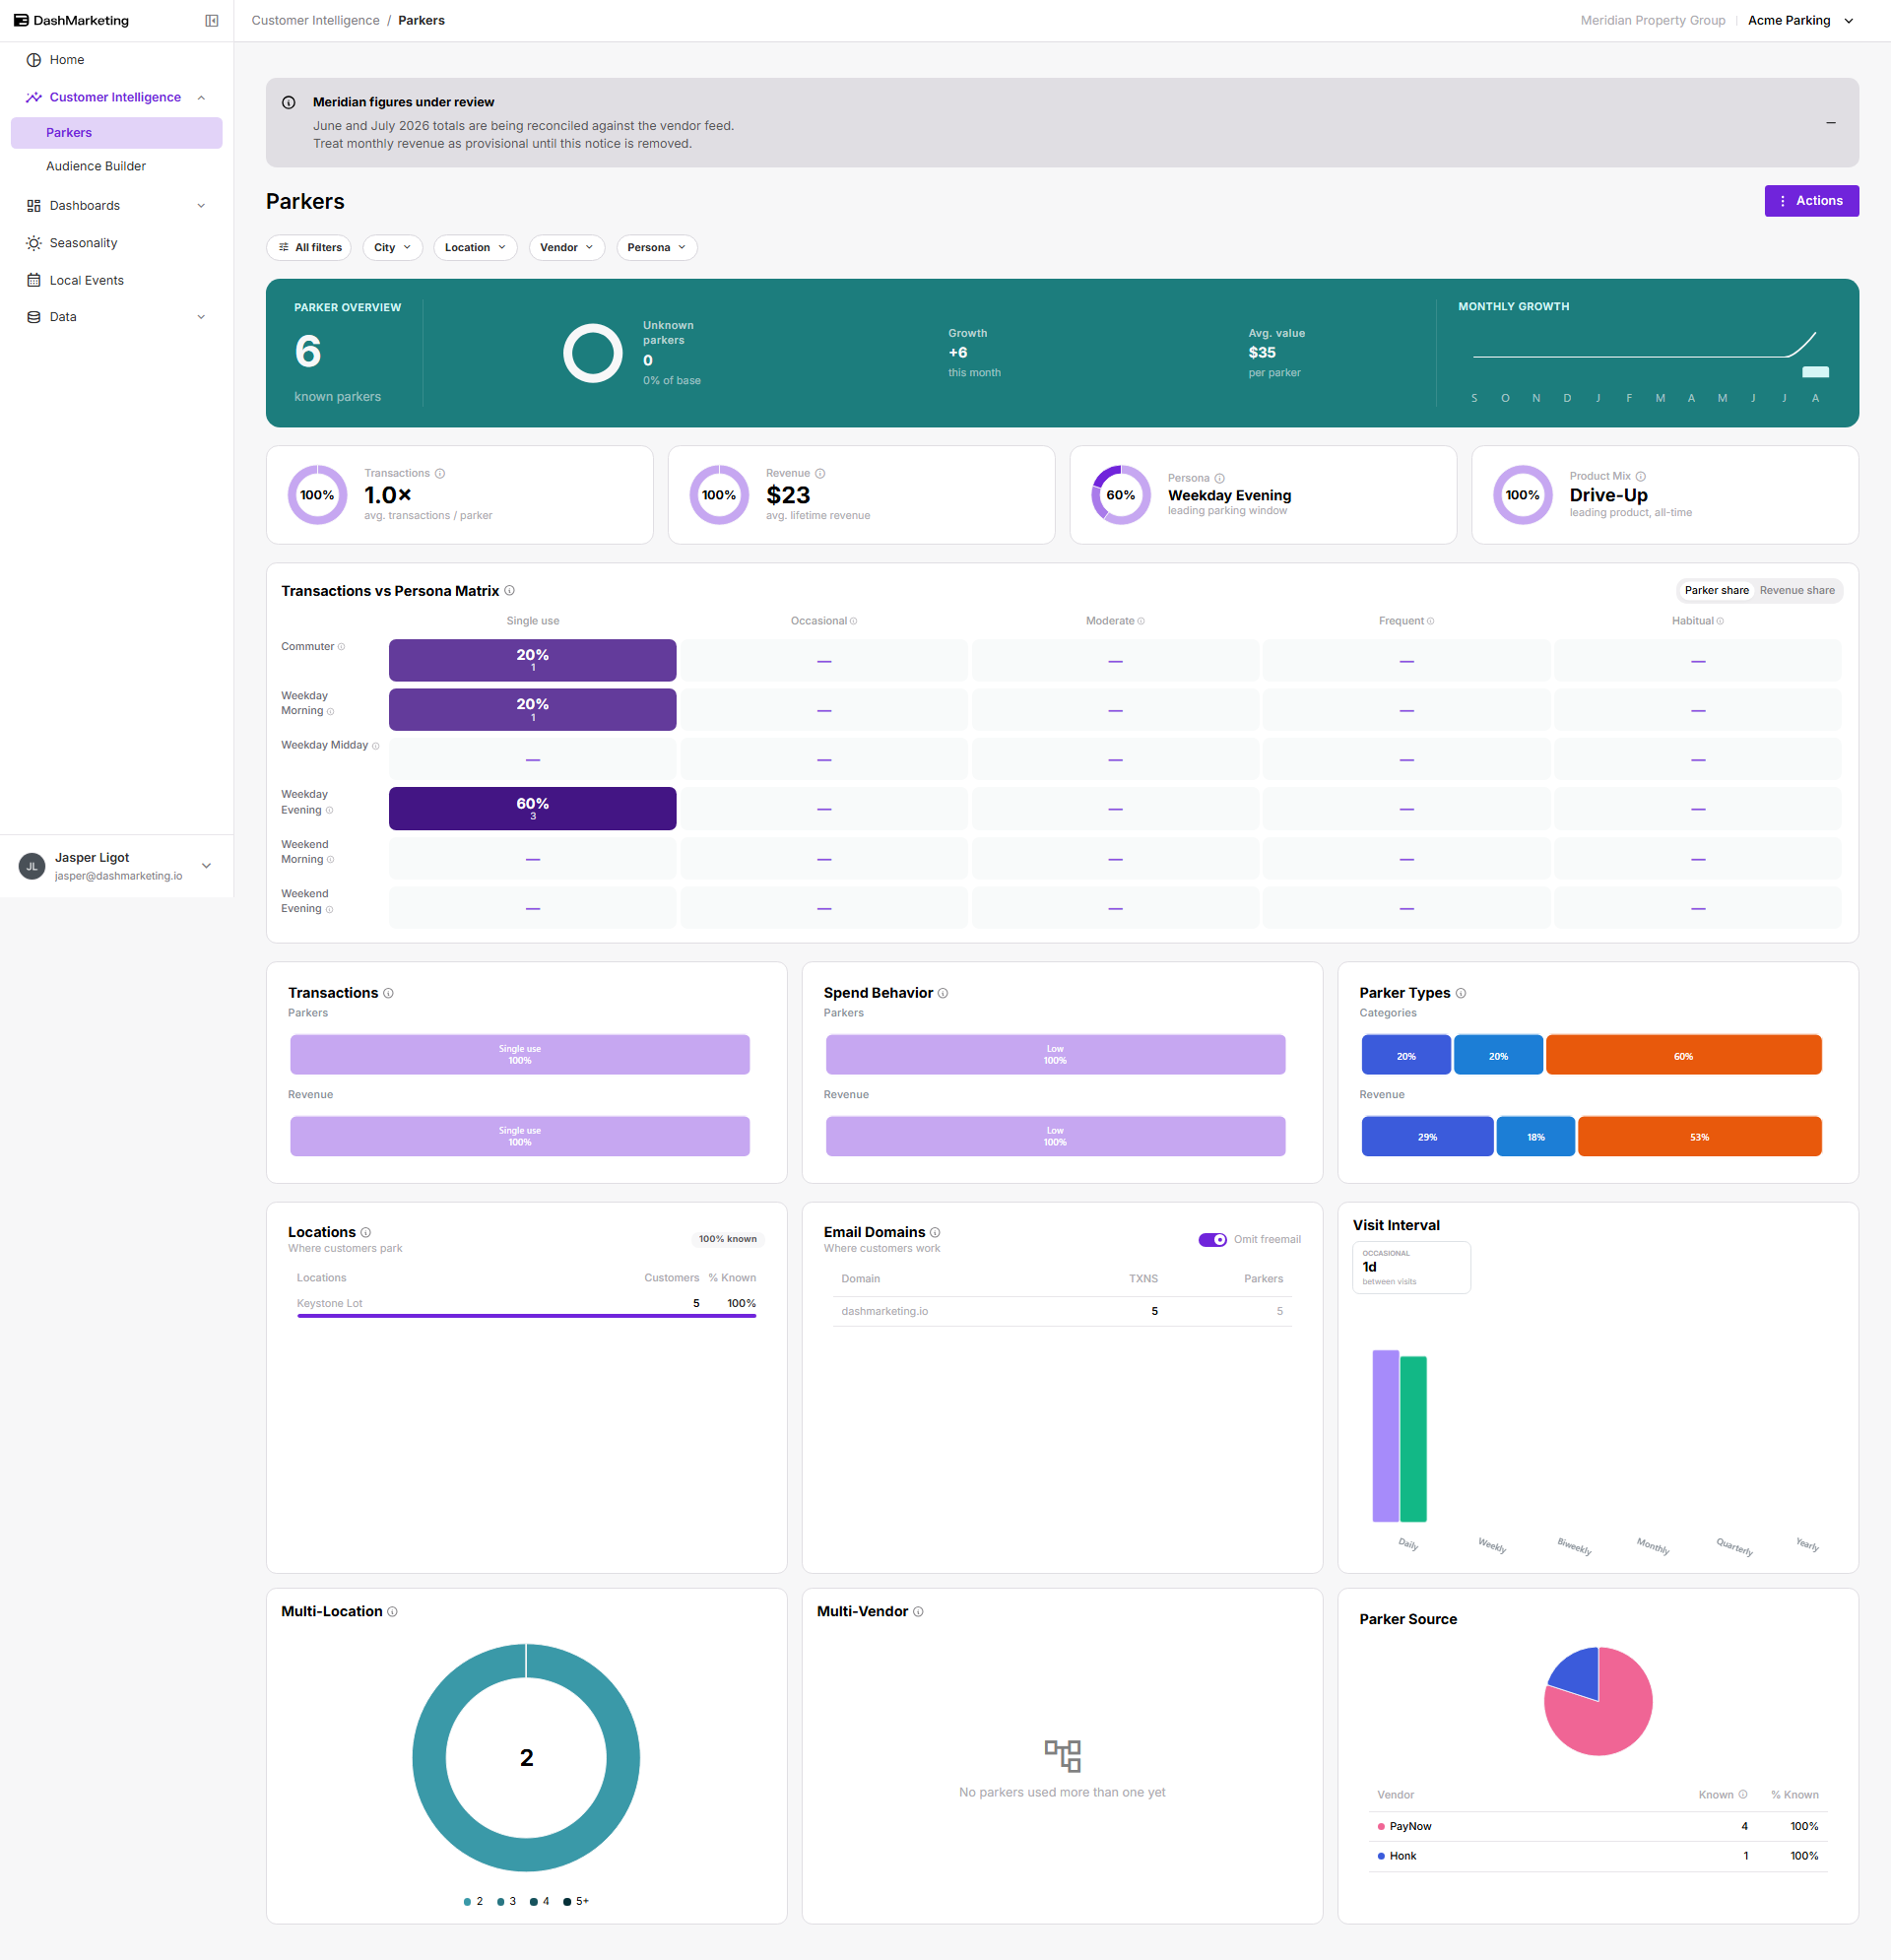 📸 Screenshot needed — client-parkers.png Client view → Customer Intelligence → Parkers, with enough parker data that the matrix renders.
Note the difference from the org view. Org users have a second page here, Parker List, with the row-level records. Clients don't. They get the aggregate view only.
Audience Builder
Builds a segment of transient parkers from behavioural filters, and saves it for reuse.
Filters available: locations and products, active-within window (7/30/90/180 days, 1 year, all time), transaction frequency bands (single use through habitual 20+), parker spend range, visit window, and visit days. The estimated audience size updates live as filters change.
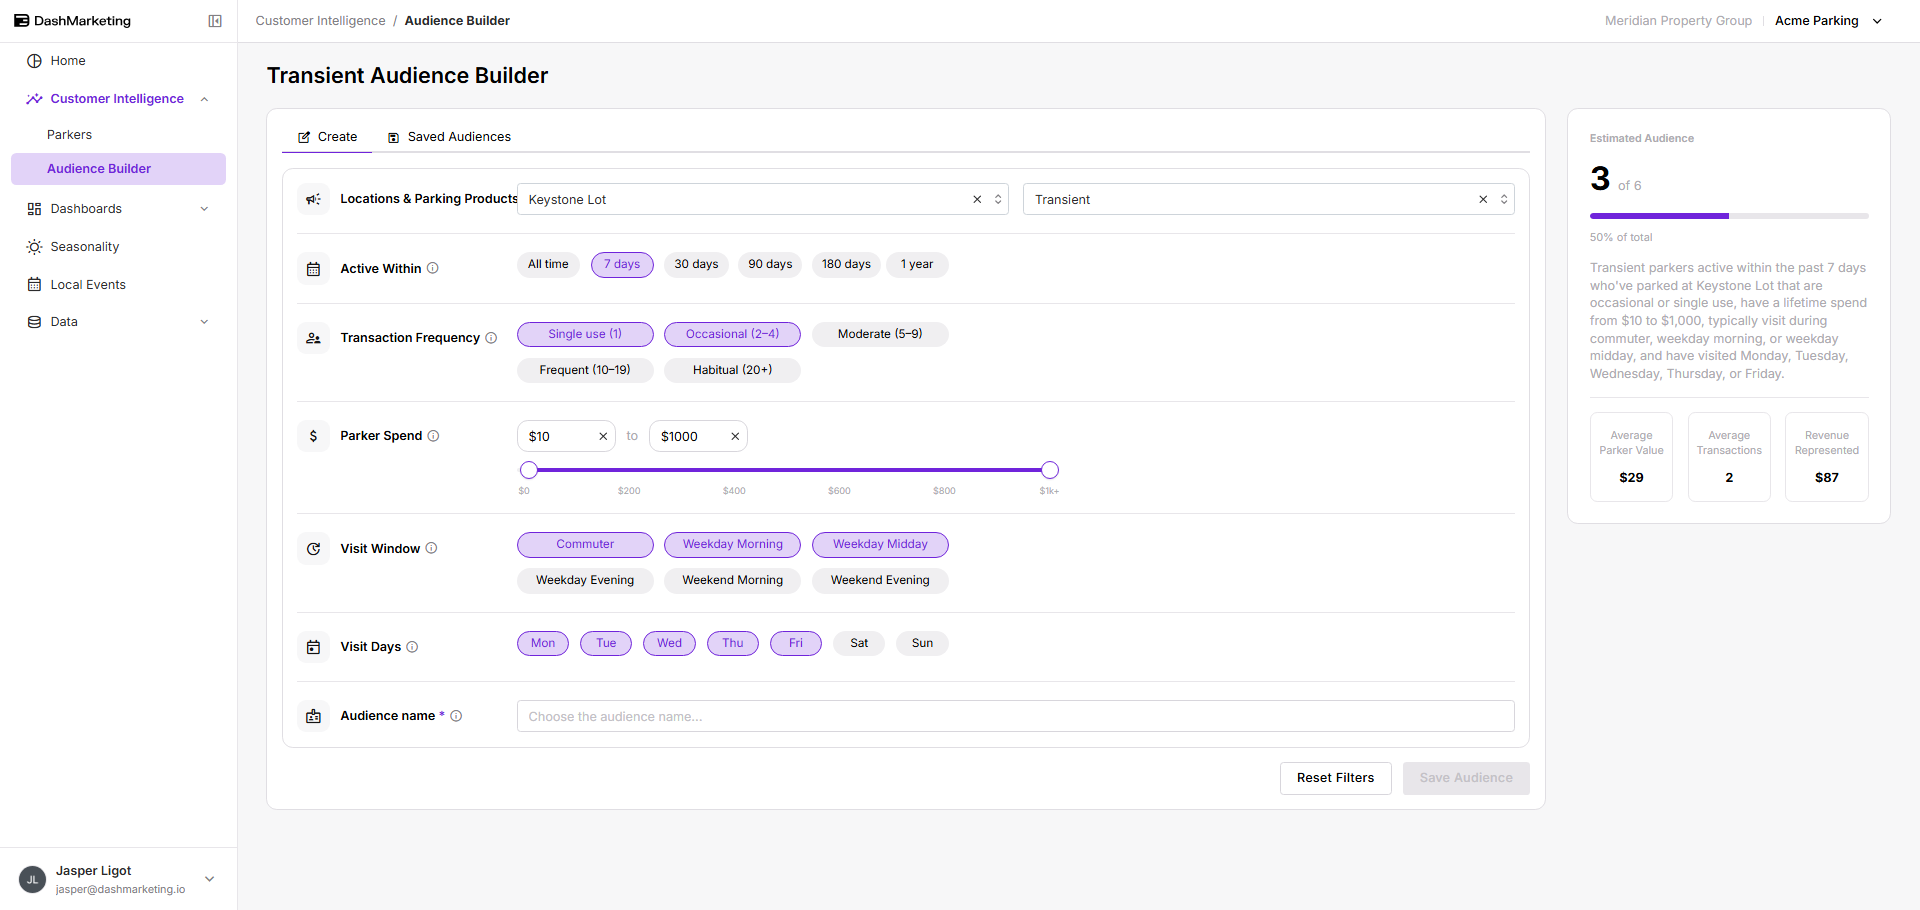 📸 Screenshot needed — client-audience-builder.png Client view → Audience Builder with several filters applied and a non-zero Estimated Audience count. Call out: the live count panel on the right.
⚠️ Verify before publishing: confirm whether a Read Only client user can save an audience or only build one. Read Only is defined as "view and export, no changes", which suggests saving is blocked — but this needs testing with a real Read Only client login, not View as Client.
Dashboards
Transients
Short-stay parking performance.
Revenue, ATV (average transaction value), Frequency, Top locations
Transient revenue by payment platform and product
Transaction heatmap by start time
Transaction segmentation — share of revenue and transactions by segment
Filters: City, Location, Vendor, Zone, Product. Period: 7d / 30d / 90d or a custom range.
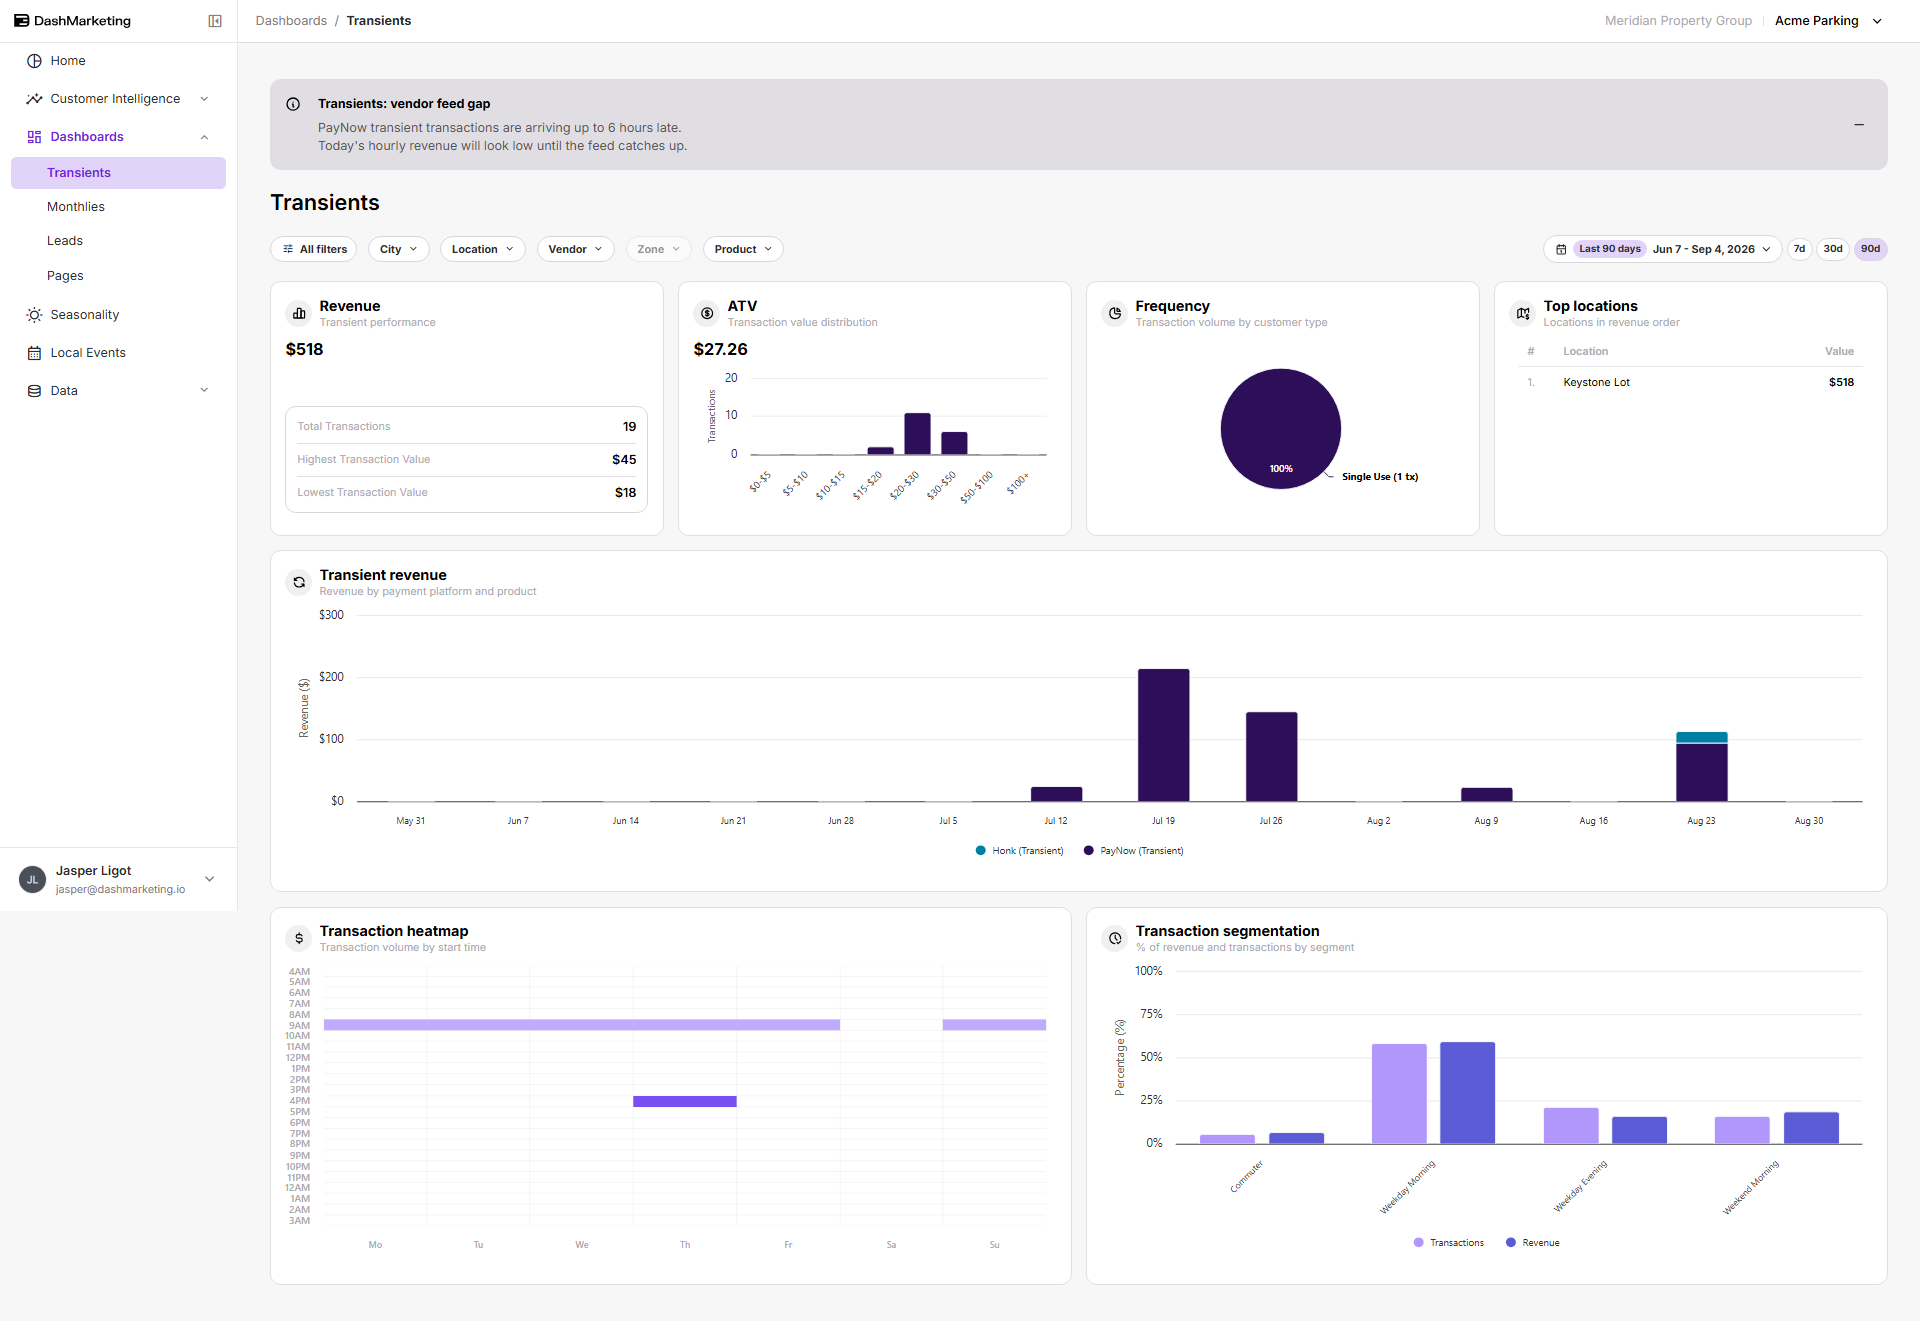 📸 Screenshot needed — client-transients.png Client view → Dashboards → Transients with data present. If a dashboard-specific disclaimer is set on this screen, capture it — it's the clearest example of per-dashboard overrides in the product.
Monthlies
Recurring parking performance.
Monthly Accounts and Monthly Parkers active at month end
Total Monthly Revenue (MRR) trend
AVG Rate per Parker
Highest Value Accounts — accounts ranked by MRR, with location
Parker Expansion / Contraction — net activity, additions, cancellations
Filters: City, Location, Vendor, Zone, plus an Include $0-rate parkers toggle. Period: month picker.
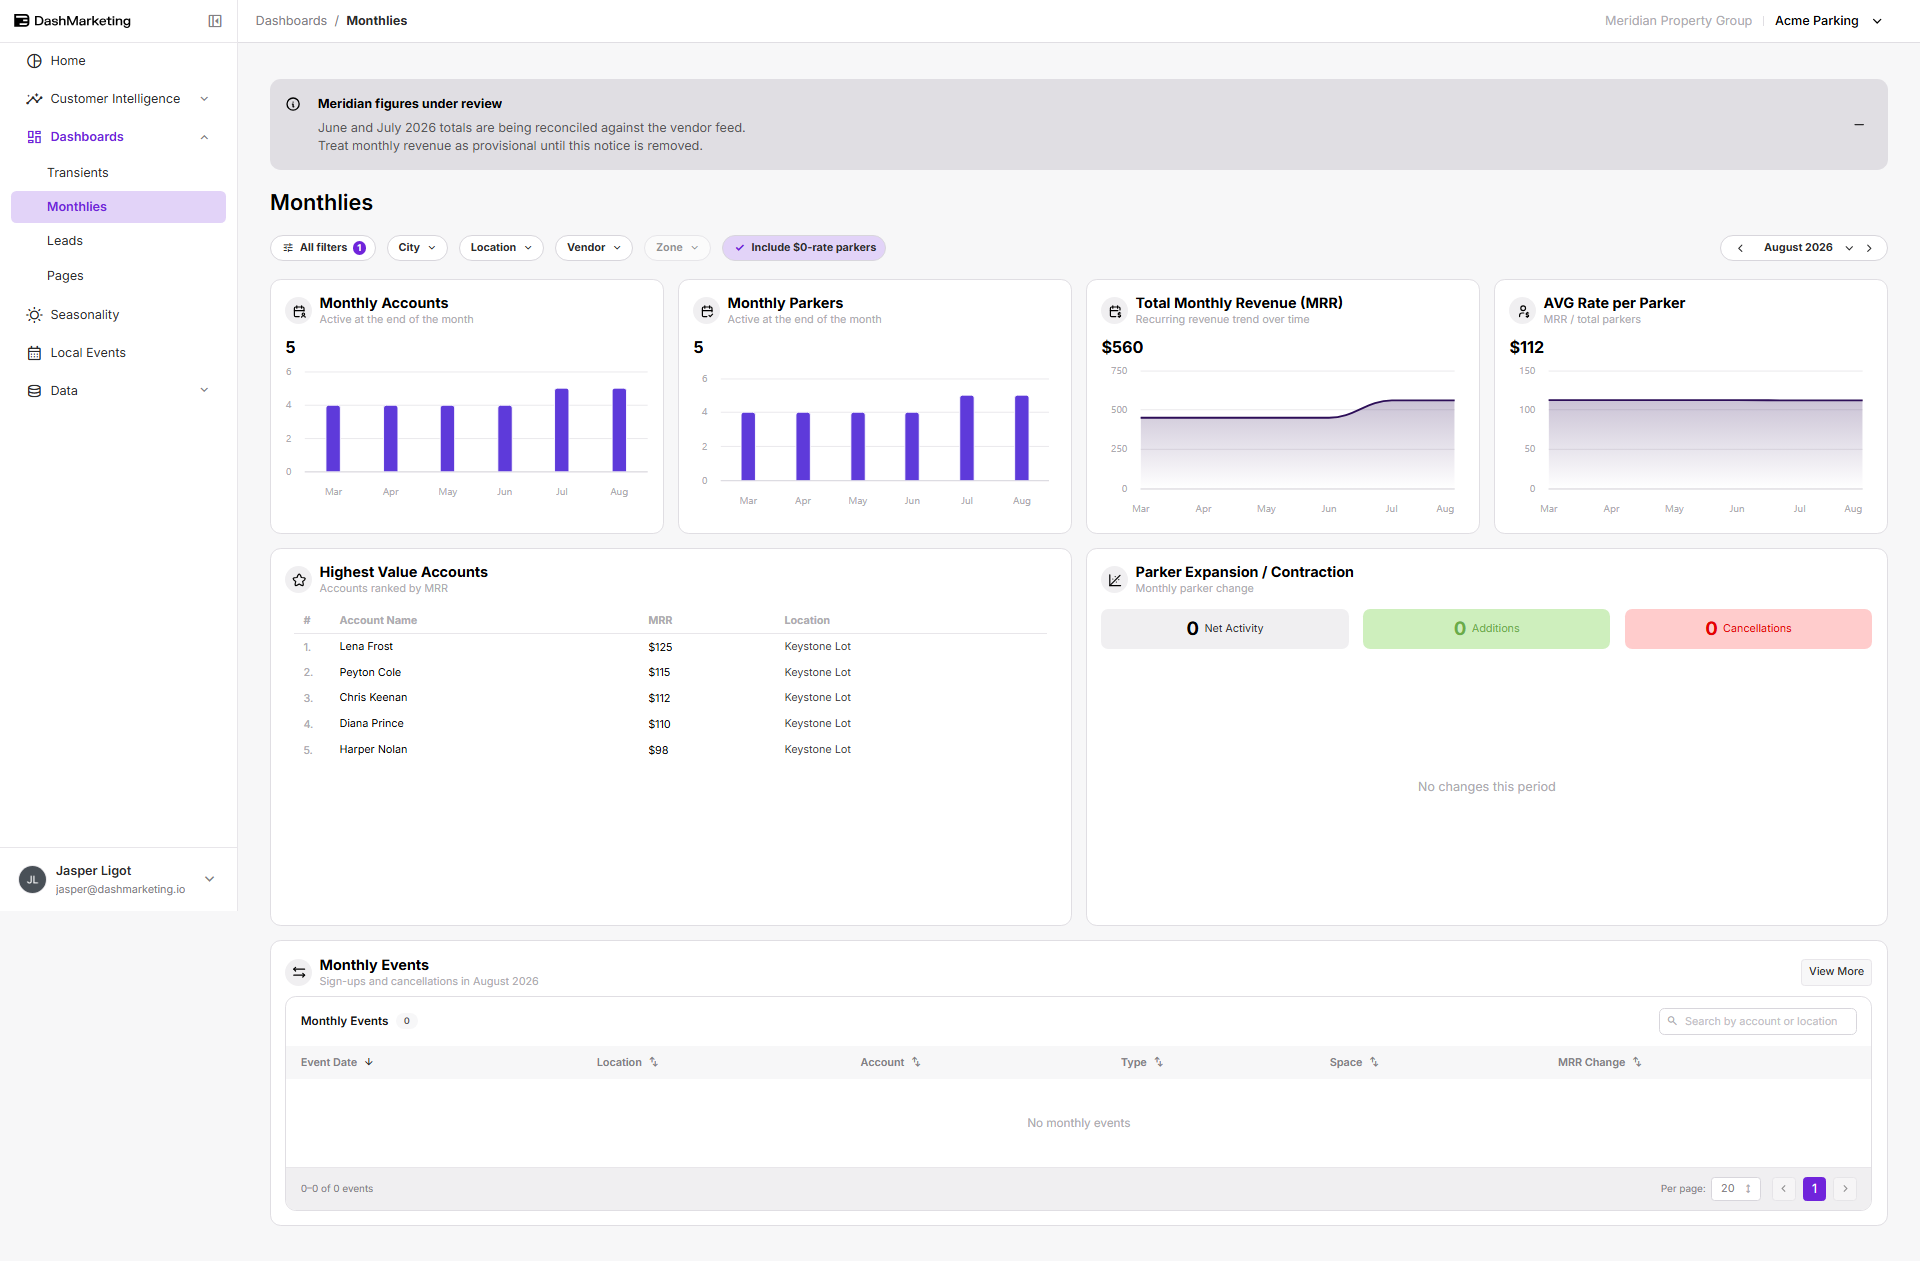 📸 Screenshot needed — client-monthlies.png Client view → Dashboards → Monthlies. Call out: the Highest Value Accounts card — it names individual account holders, which is exactly the row-level detail the Analyst role is meant to suppress. Useful as the concrete example when explaining role choice.
Leads
Lead capture from DashPages.
Leads Over Time by source
Conversions and conversion rate
Top Lead Locations
Top Email Domains, with an Omit freemail toggle
A searchable lead table below
Filters: City, Location, Page, Only converted toggle. Period: 7d / 30d / 90d.
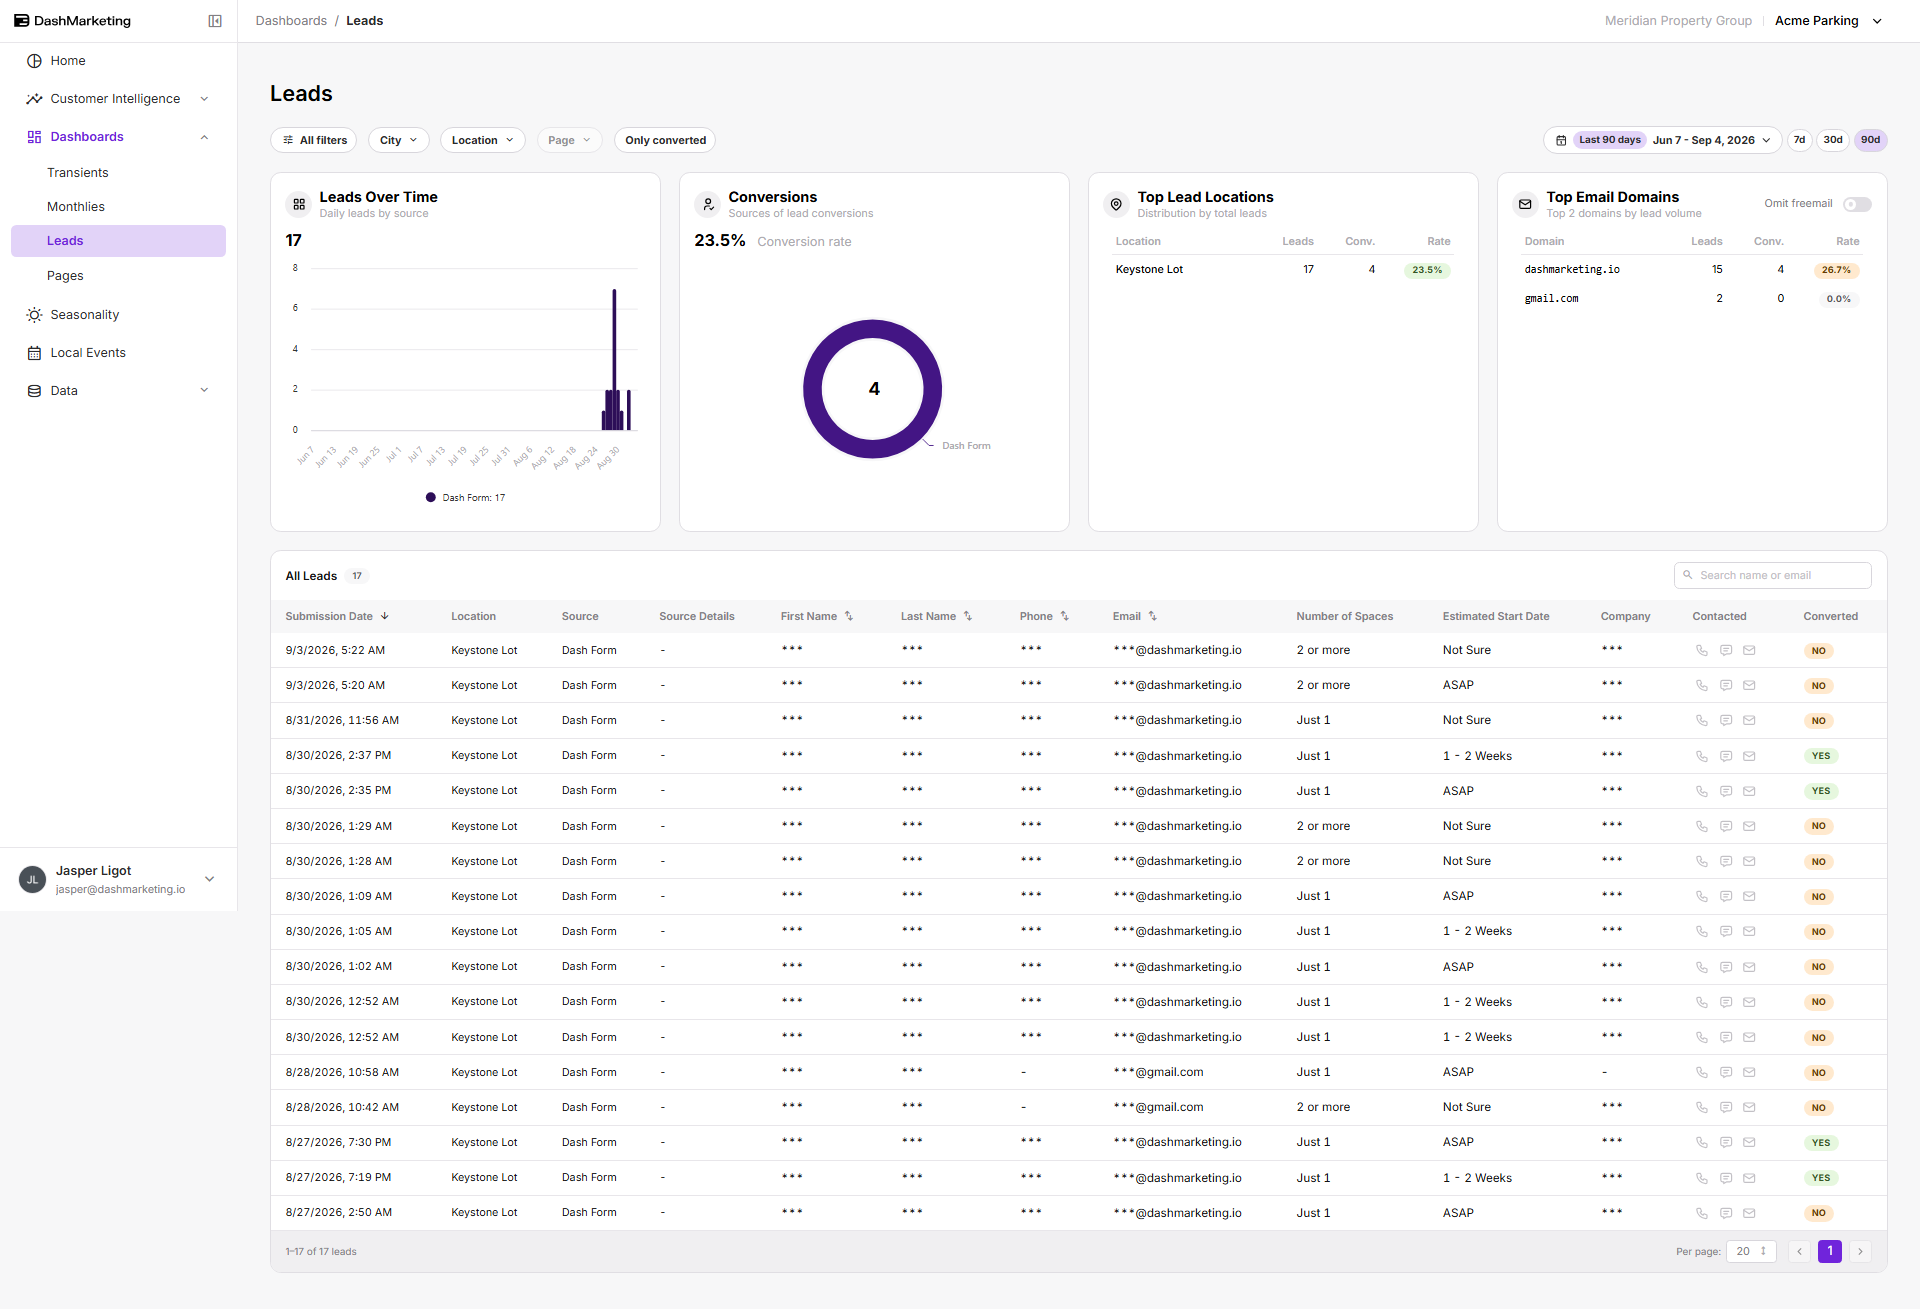 📸 Screenshot needed — client-leads.png Client view → Dashboards → Leads, with leads in the selected range.
Pages
DashPages performance for the client's pages.
Total Pages, average pages per location, active vs inactive
Page Types breakdown
Top page views
Total Page Views over time
Button Clicks by category
Page View Heatmap and Views by day of week
Filters: City, Location, Page. Period: 7d / 30d / 90d.
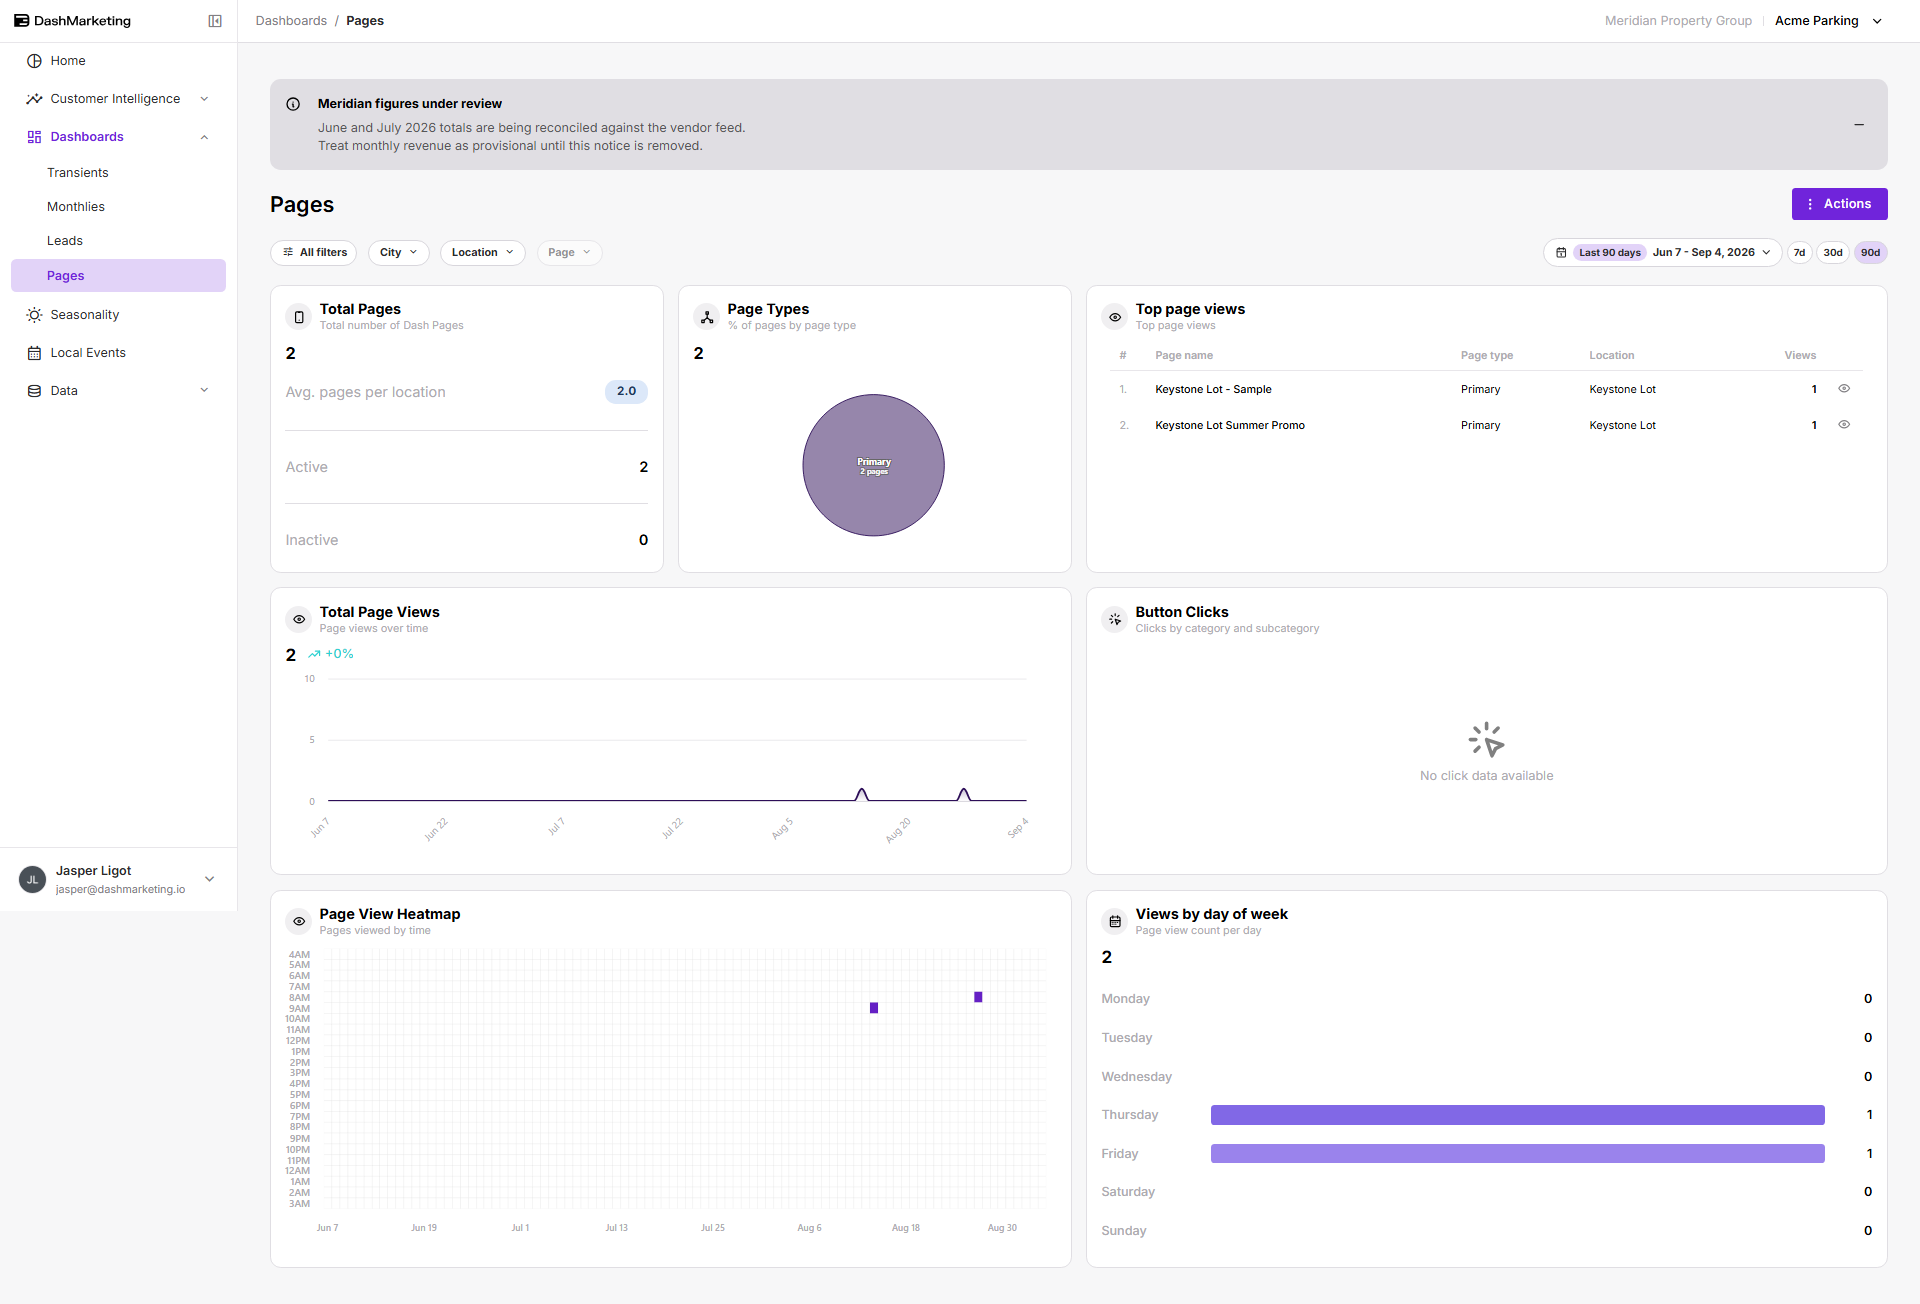 📸 Screenshot needed — client-dashboard-pages.png Client view → Dashboards → Pages with page view data present.
Seasonality
External influences on demand.
Days of week — revenue impact against the prior month, with a three-month average value per day
Weather — snowfall, rain, sunny days, highs and lows, and averages
Holidays — holiday impact
Yield Calendar — a month grid of daily value or volume with the day's weather overlaid
Filters: City (pinned to a city), Location. Period: month picker.
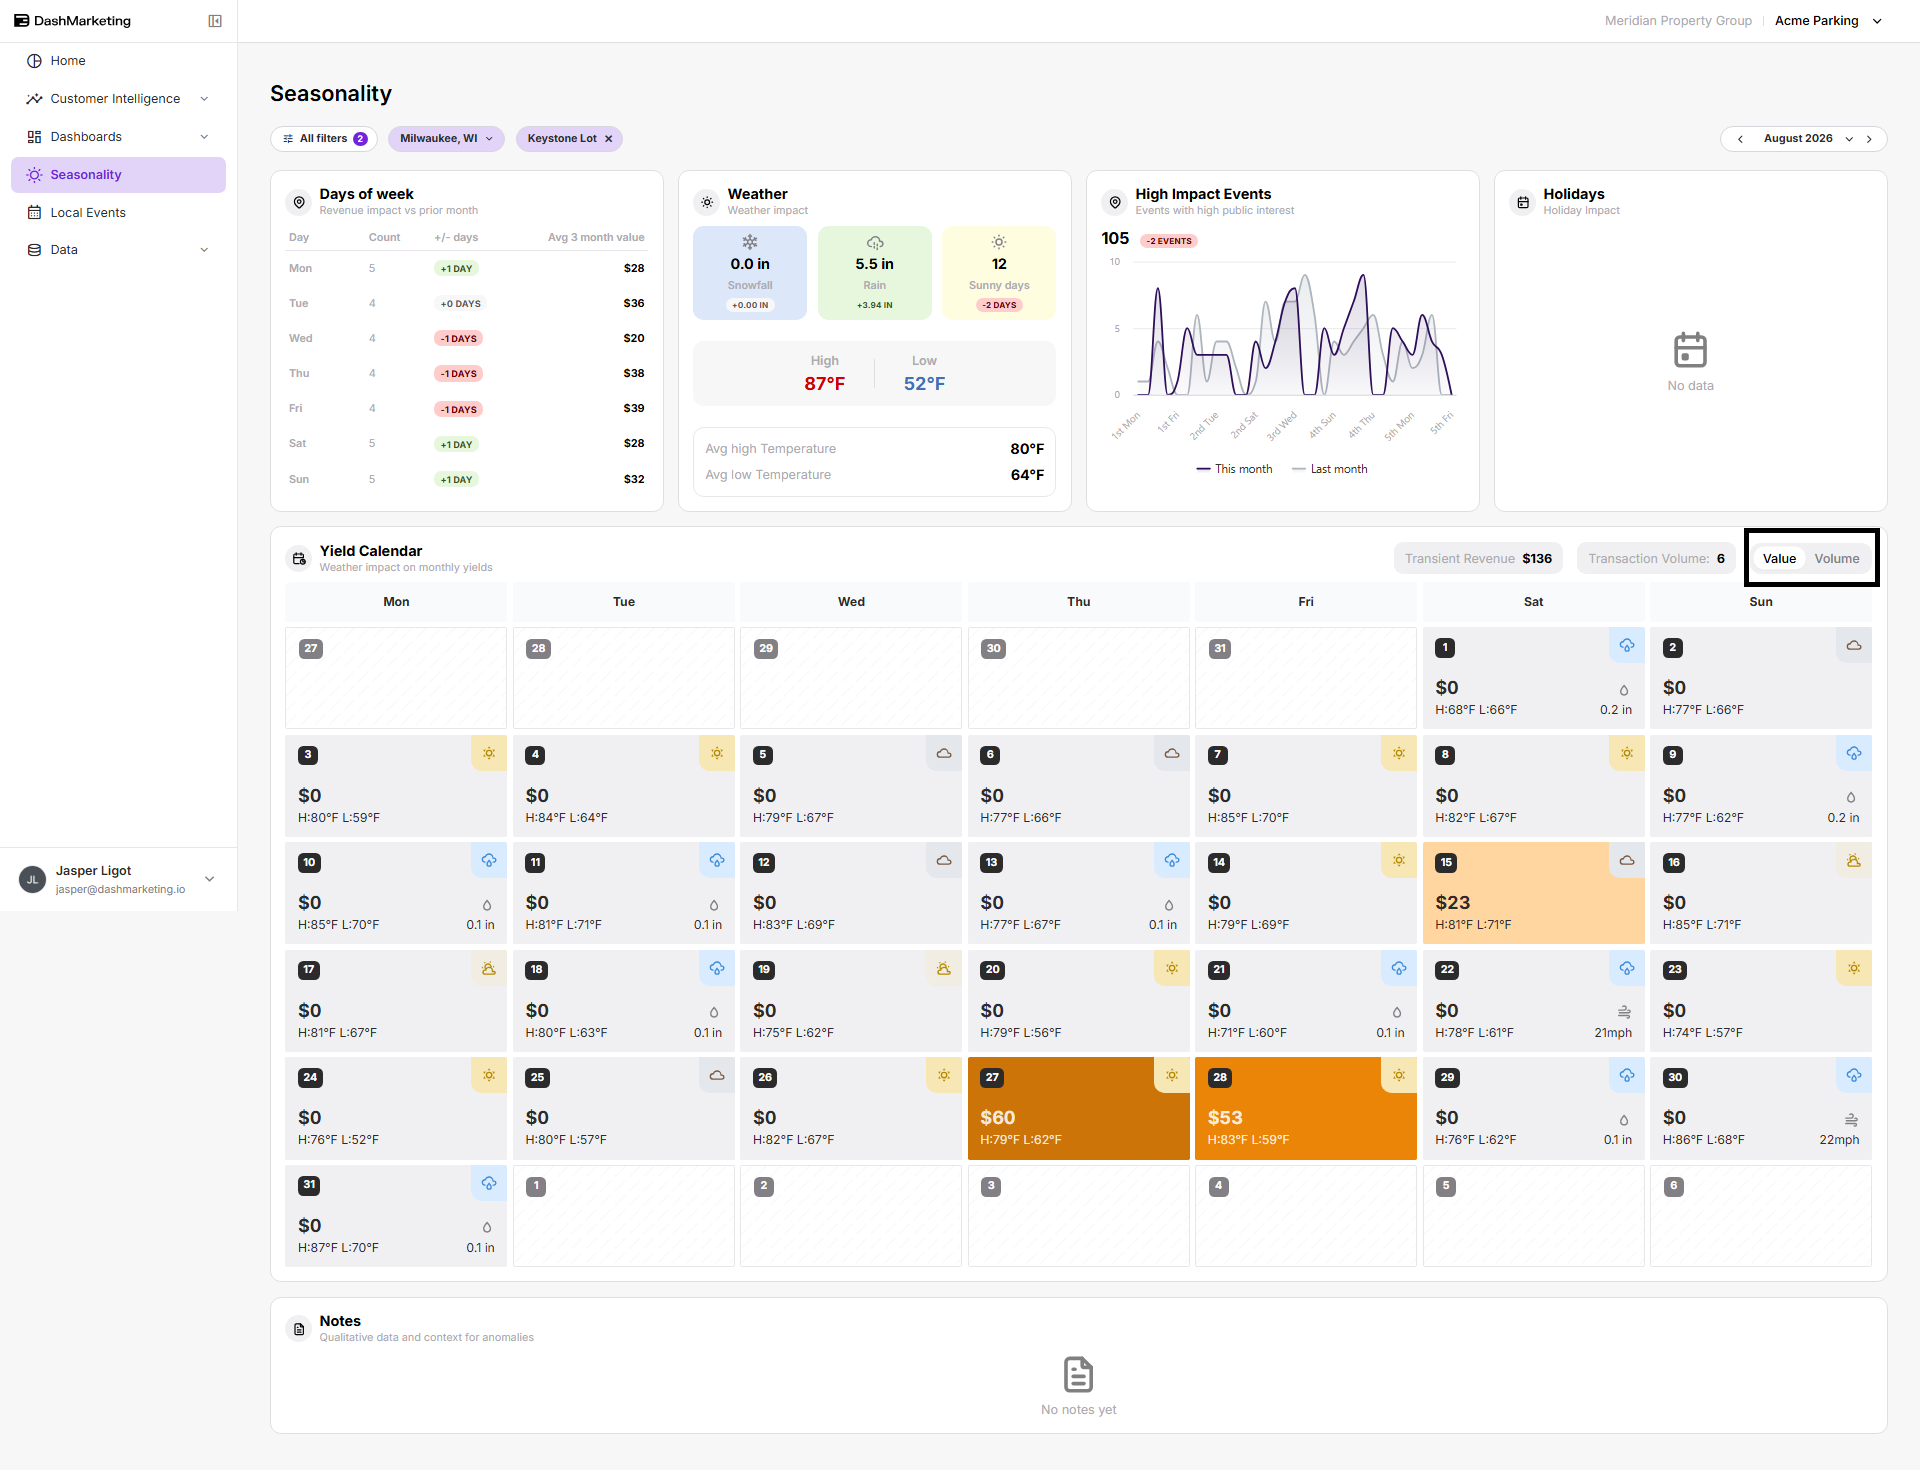 📸 Screenshot needed — client-seasonality.png Client view → Seasonality with the Yield Calendar populated. Call out: the Value / Volume toggle on the calendar.
Local Events
Events near the client's locations that could move demand.
Total events in the period, today, and this weekend
Upcoming Events calendar
Interest level distribution
Top Venues
Event categories treemap
Impacted locations — the client's locations with events within half a mile
A Map tab alongside the list
Filters: Event City, Event Venue, Interest Level, Favorites only toggle. Period: date range.
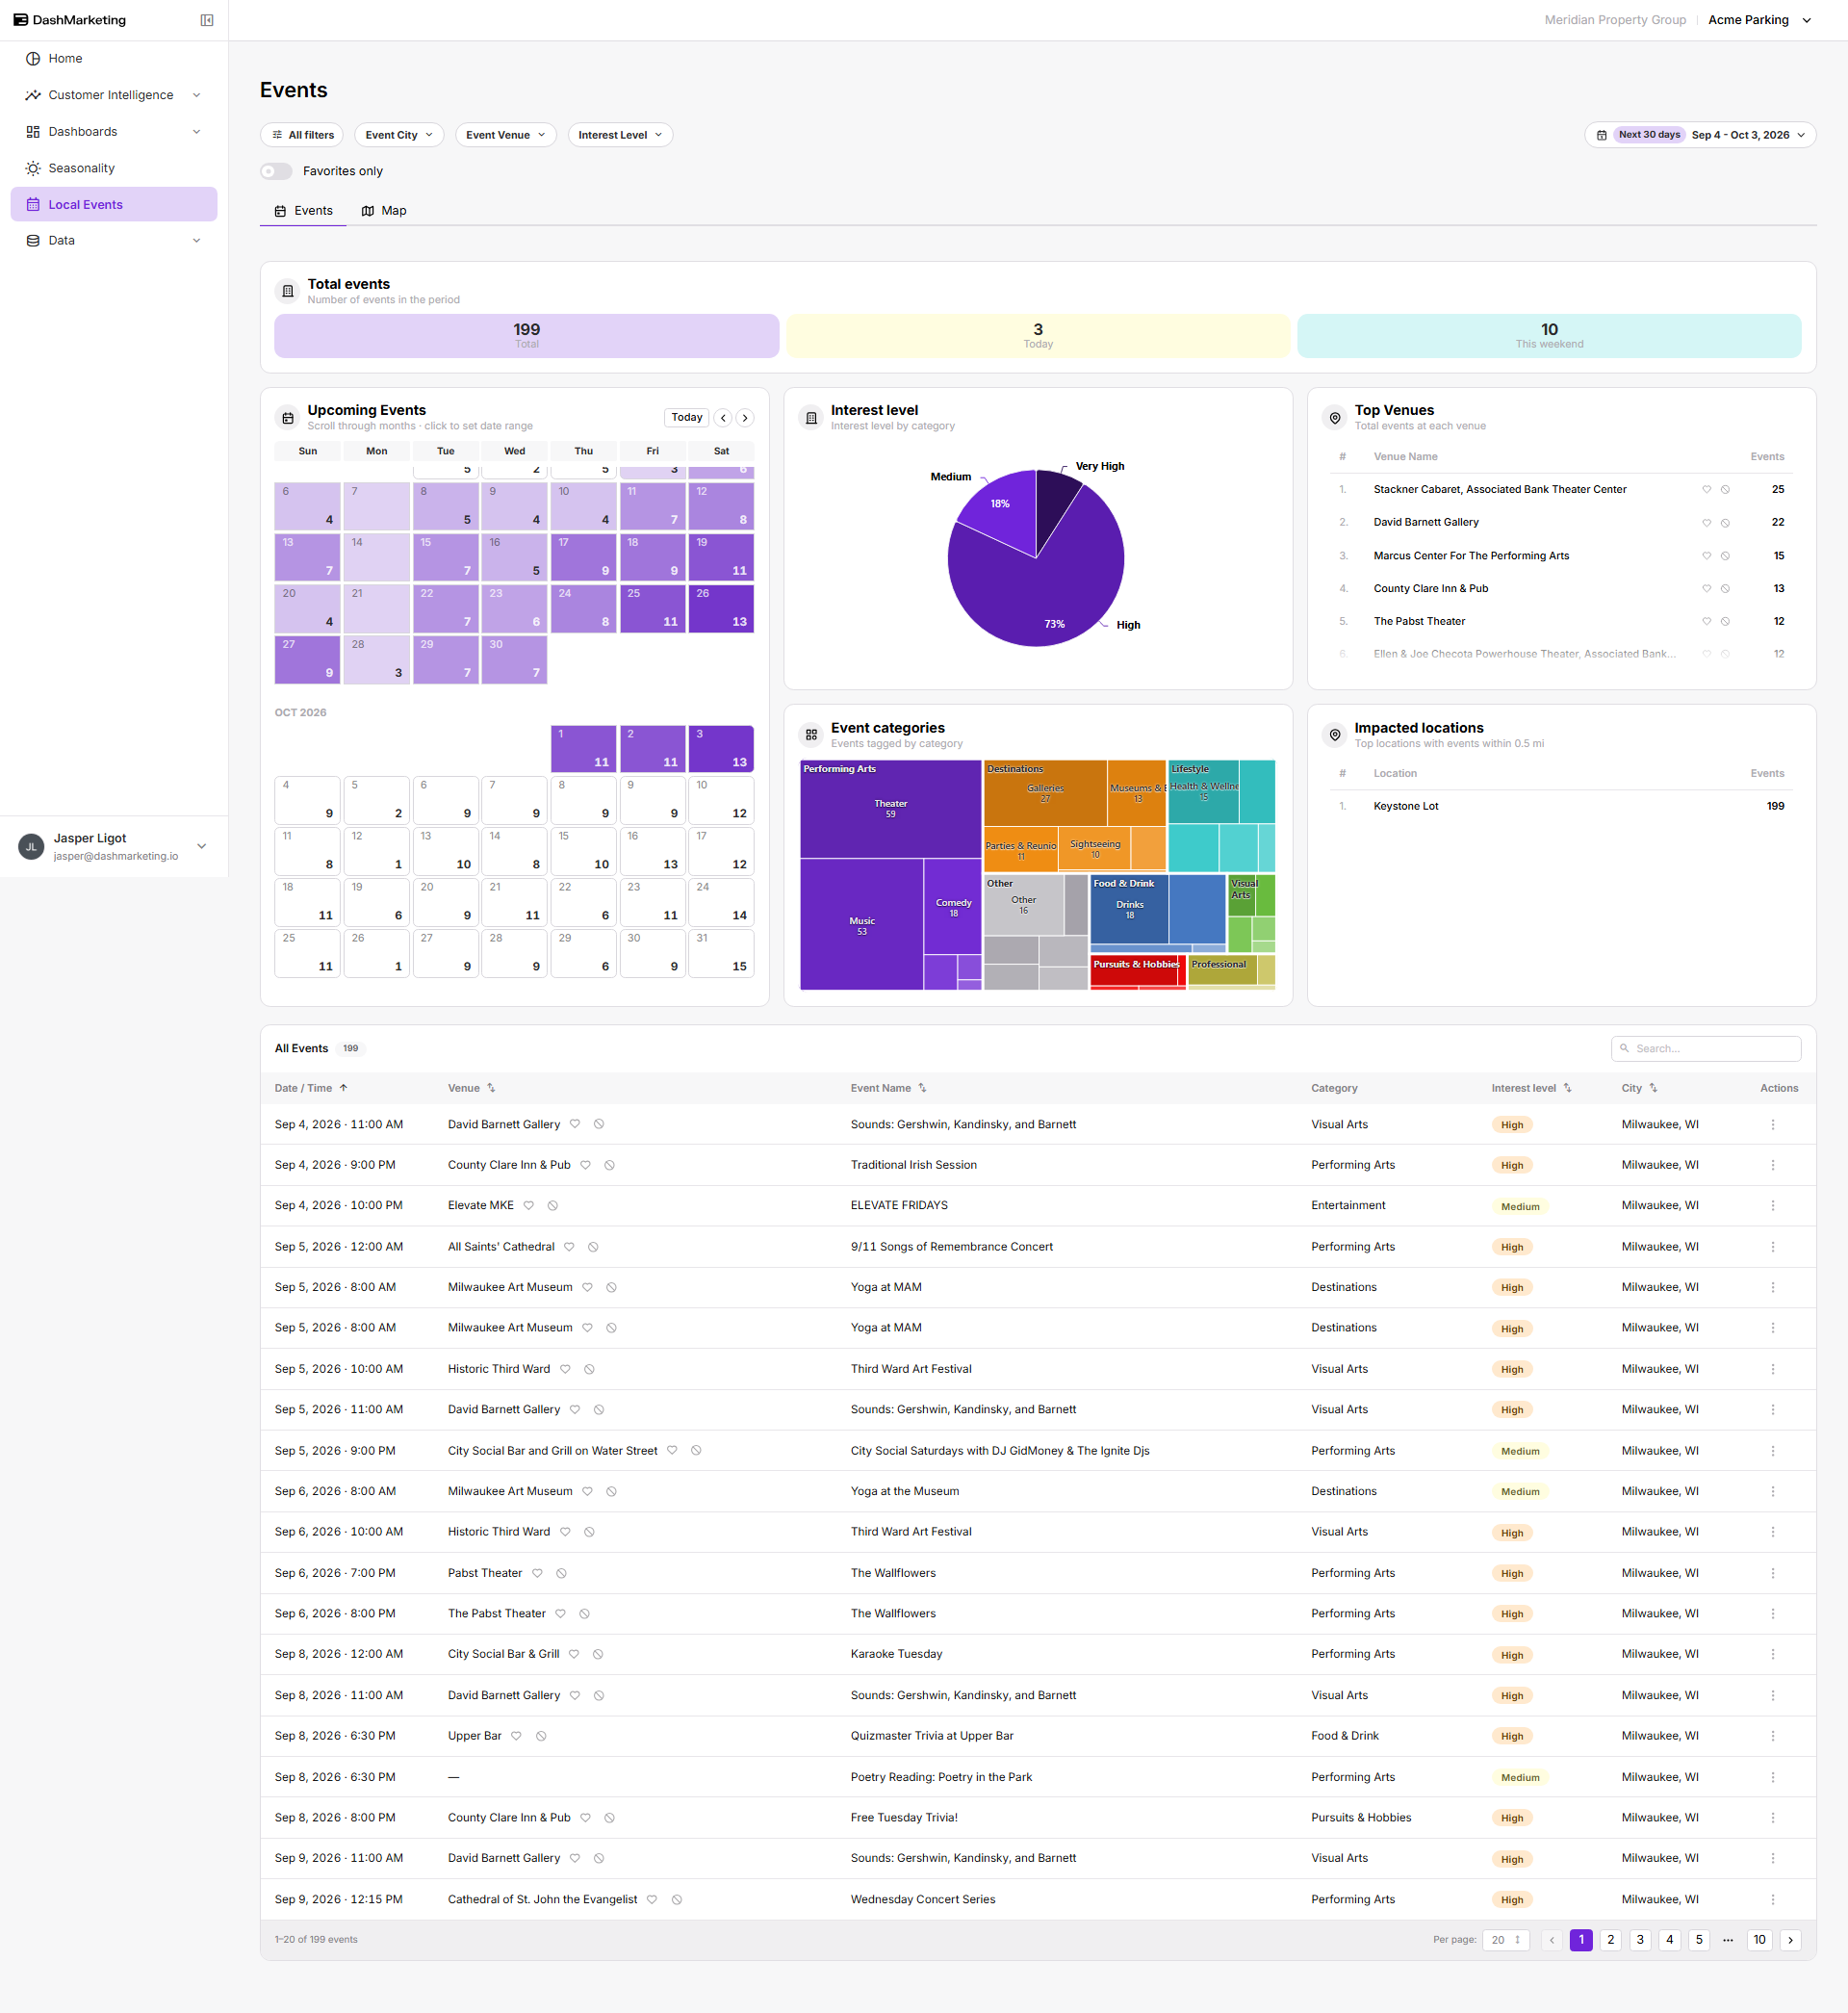 📸 Screenshot needed — client-local-events.png Client view → Local Events on the Events tab.
Data
Locations
The client's locations as a table: name, UID, address, city, group, operation type, active status, created date. Summary cards above for total locations, total spaces, cities, and asset type.
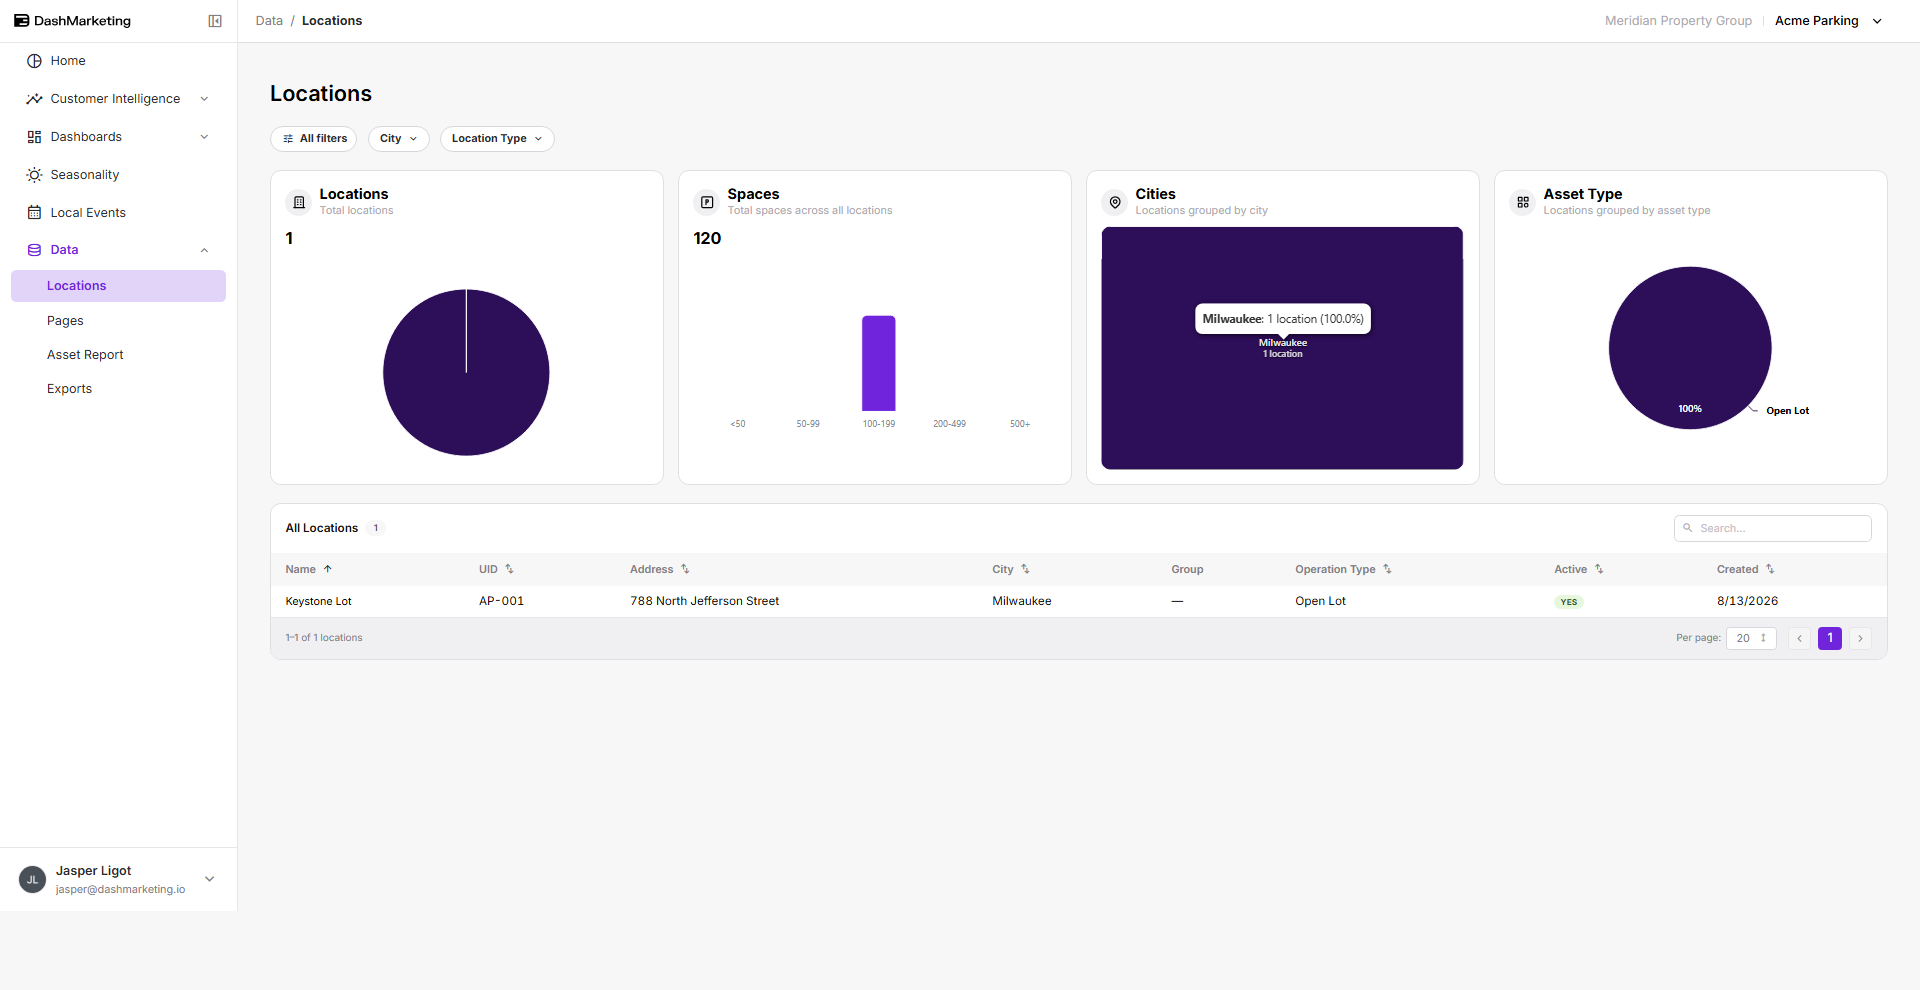 📸 Screenshot needed — client-data-locations.png Client view → Data → Locations with more than one location listed.
Pages
The client's DashPages as records — name, type, title, slug, created date, views, active status. Summary cards for pages, views, clicks, and top views.
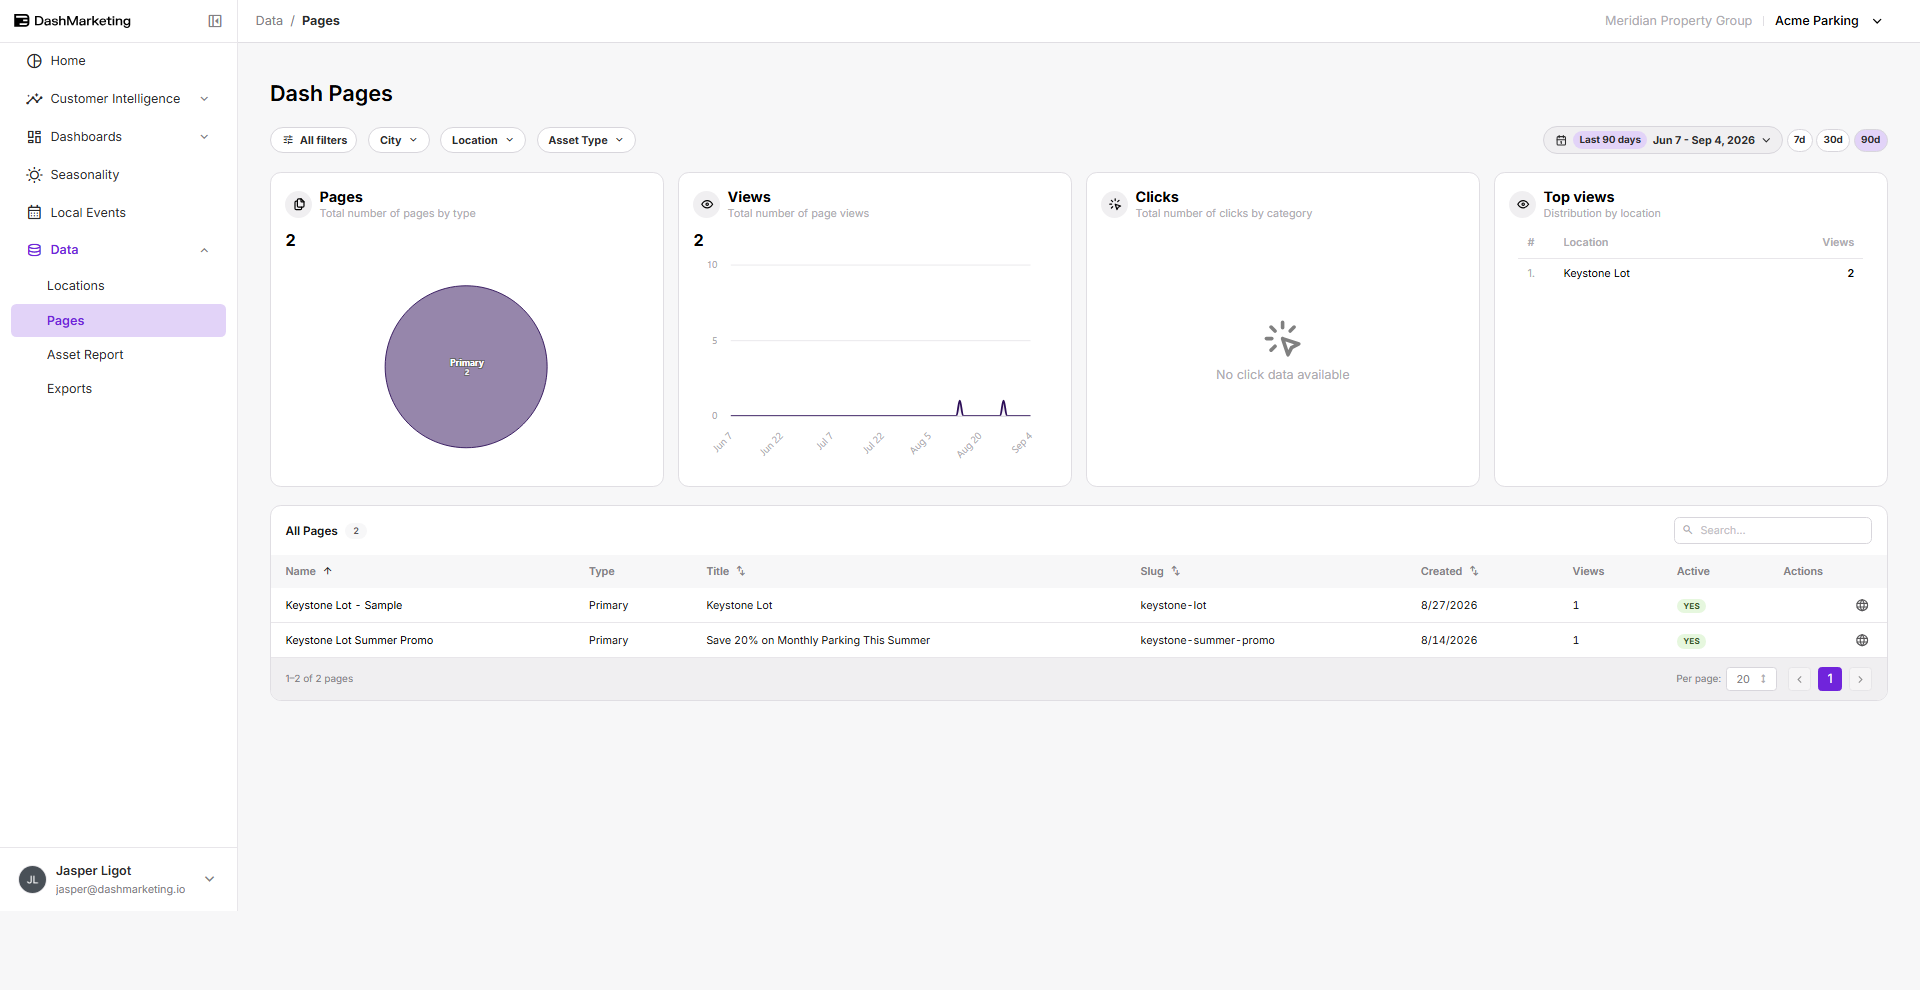 📸 Screenshot needed — client-data-pages.png Client view → Data → Pages. Call out: there is no + Create Page button here. Org users have one; clients don't.
Asset Report
A written performance summary for the period, followed by transient and monthly performance sections. This is the closest thing in the product to the monthly report you'd otherwise be writing by hand.
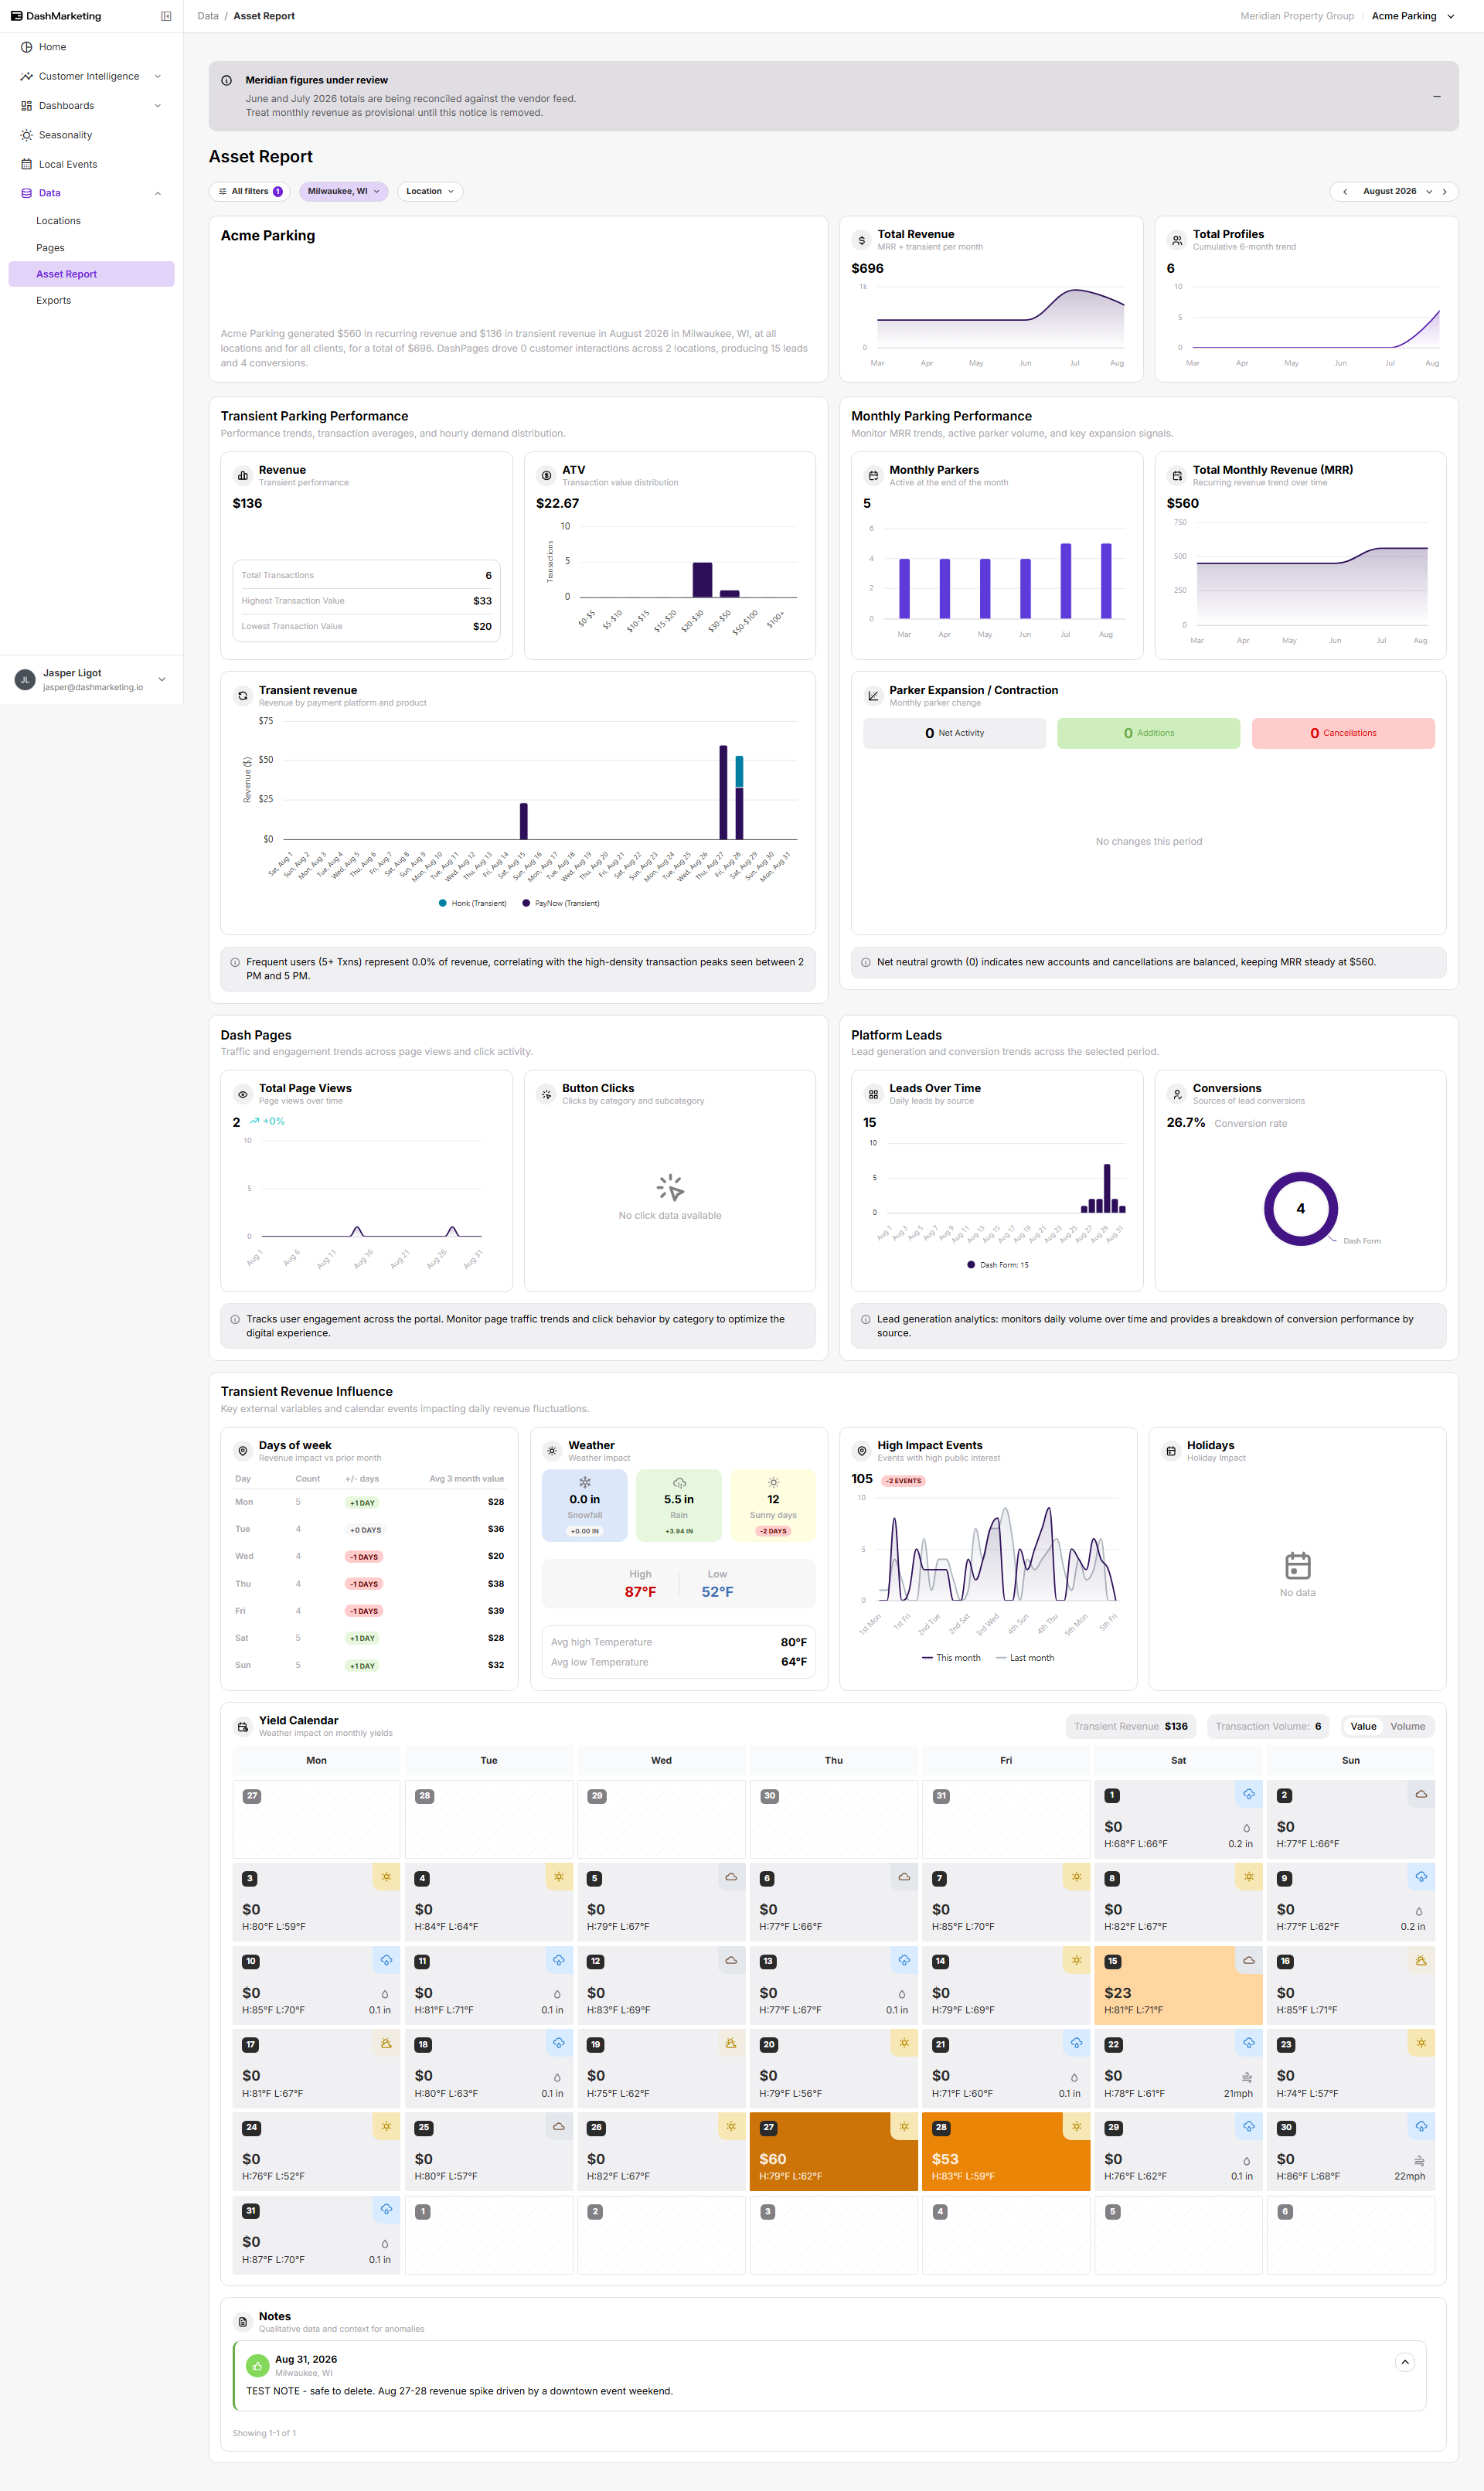 📸 Screenshot needed — client-asset-report.png Client view → Data → Asset Report.
⚠️ Fix before publishing. In the client view the Asset Report card is currently headed with the organization name, and the narrative paragraph reads "...at all locations and for all clients." The figures underneath are correctly scoped to the client, but the wording isn't. Worth an engineering ticket before this page ships — a client reading "for all clients" on their own report will ask what they're being shown.
Exports
Requested reports with their reference ID, type, status, client, location, reporting period, and last update. Filters: Report Type, Status, Location, City, and month.
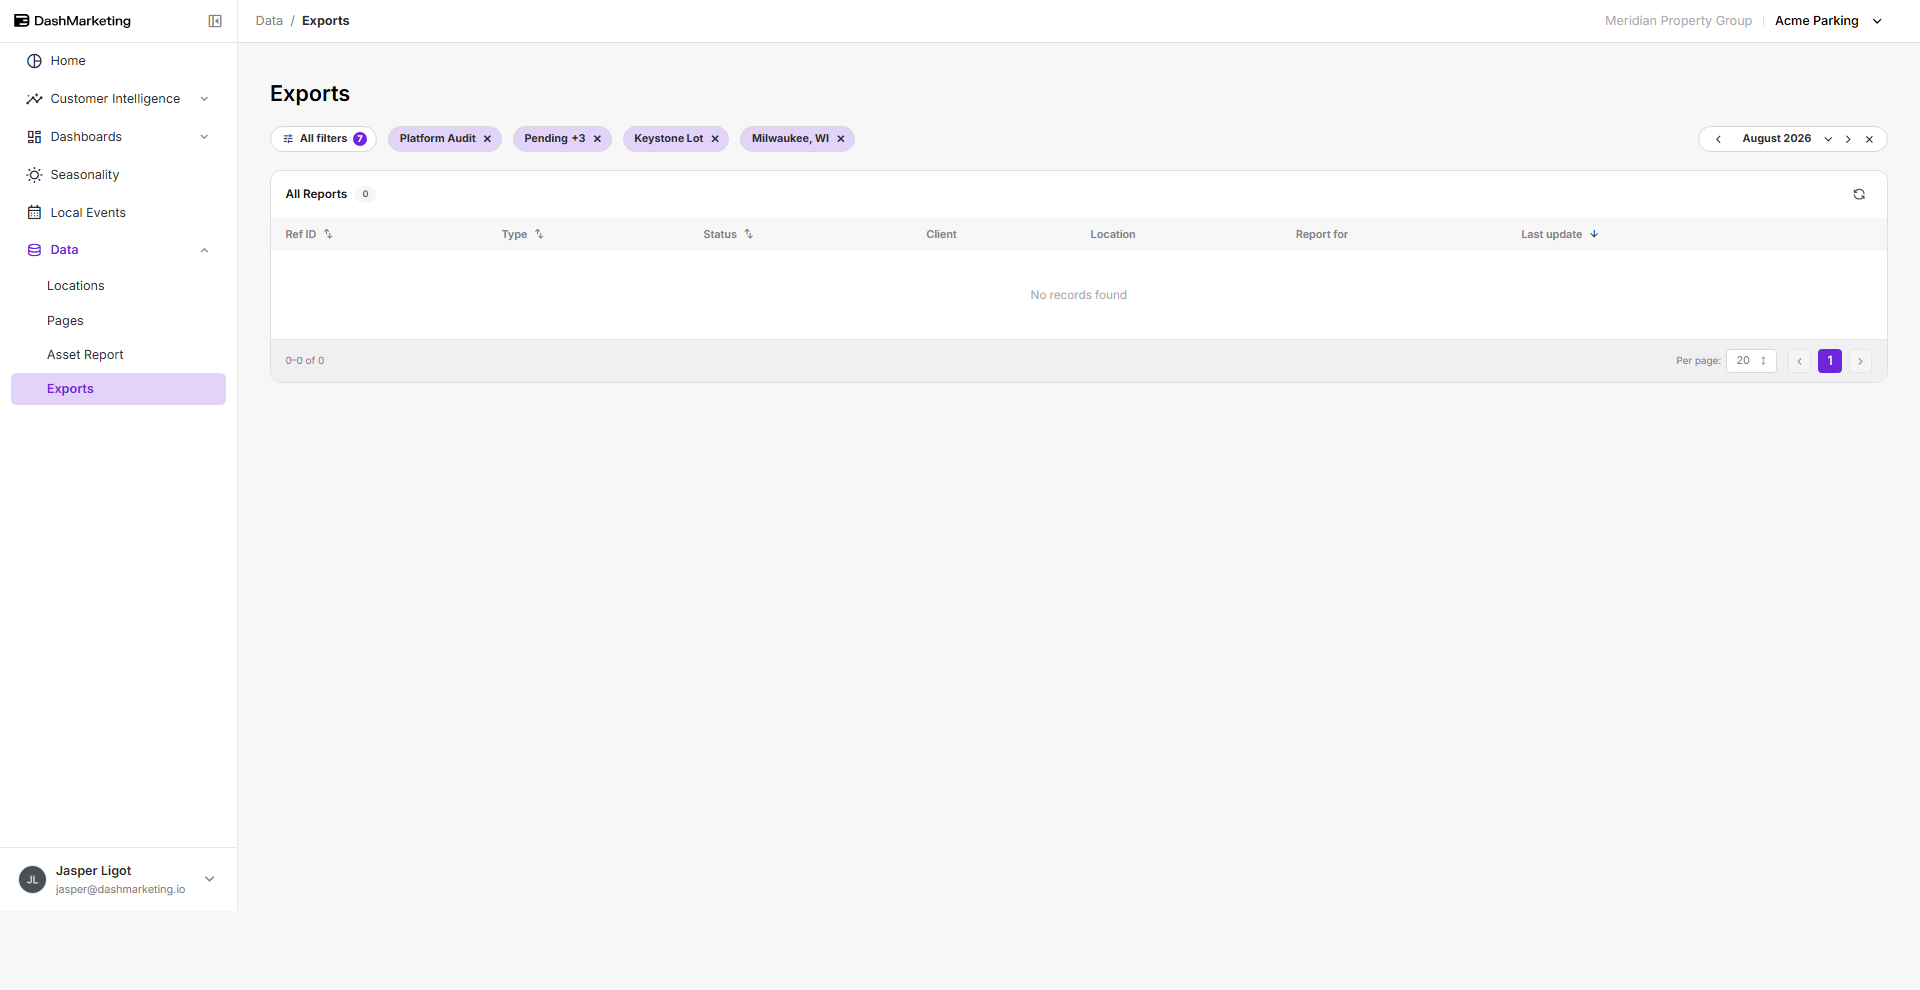 📸 Screenshot needed — client-exports.png Client view → Data → Exports with at least one completed export in the list.
Account menu
Bottom of the sidebar. Manage account opens a profile panel with Profile and Security sections — name, email addresses, connected accounts. Logout signs out.
This is the client's own account, not their client record. Nothing here changes their scope or role.
Related
What clients see — the navigation map and org-vs-client comparison
Client users and roles — how role choice changes what's on these screens
Was this page helpful?